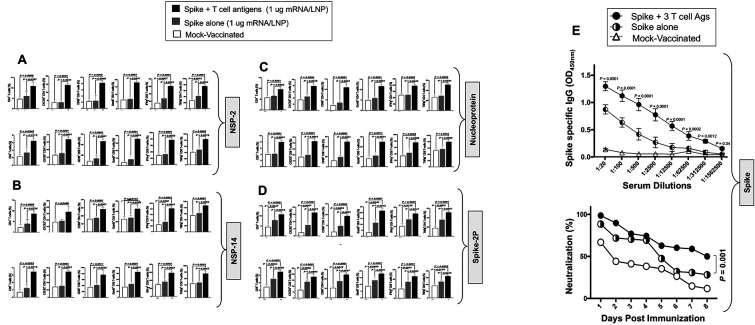
Figure 8. Lungs-resident antigen-specific functional CD4+ T and CD8+ T cells induced by the combined NSP-2, NSP-14, and Nucleoprotein-based mRNA/LNP vaccines in the hamsters:
The panel shows average frequencies of functional CD4+ and CD8+ T cells in the lungs of hamsters vaccinated with the combined NSP-2, NSP-14, and Nucleoprotein-based mRNA/LNP vaccines. The graphs depict the differences in the percentage of (A) NSP-2-specific, (B) NSP-14-specific, (C) nucleoprotein- and (D) Spike-specific CD4+ and CD8+ cells present in the lungs of non-protected mock-vaccinated hamsters and lungs of protected spike-alone-mRNA/LNP and combined Spike, NSP-2, NSP-14, and Nucleoprotein-based mRNA/LNP vaccinated hamsters. Bars represent the means ± SEM. ANOVA test was used to analyze the data. (E) Top Panel: Graph showing the IgG level among hamsters vaccinated with a combination of NSP-2, NSP-14, and Nucleoprotein-based mRNA/LNP vaccines, spike alone vaccine, and mock vaccination. Bottom Panel: Neutralization assay data among the vaccinated and mock-vaccinated groups showing vaccine-induced serum-neutralizing activities. Comparison of the neutralizing antibodies induced by the combination of Spike mRNA/LNP vaccine and highly conserved protective T-cell Ags, NSP-2, NSP-14, and Nucleoprotein expressed as nucleoside-modified mRNA sequences derived from BA.2.75 Omicron sub-variant (BA2) and encapsulated in lipid nanoparticles (LNP). The data represent two independent experiments; the graphed values and bars represent the SD between the two experiments. Data are presented as median and IQR where appropriate. Data were analyzed by multiple t-tests. Results were considered statistically significant at P < 0.05. The Mann-Whitney test (two groups) or the Kruskal-Wallis test (more than two groups) were used for statistical analysis. ns P > 0.05, * P < 0.05, ** P < 0.01, *** P < 0.001, **** P < 0.0001.

