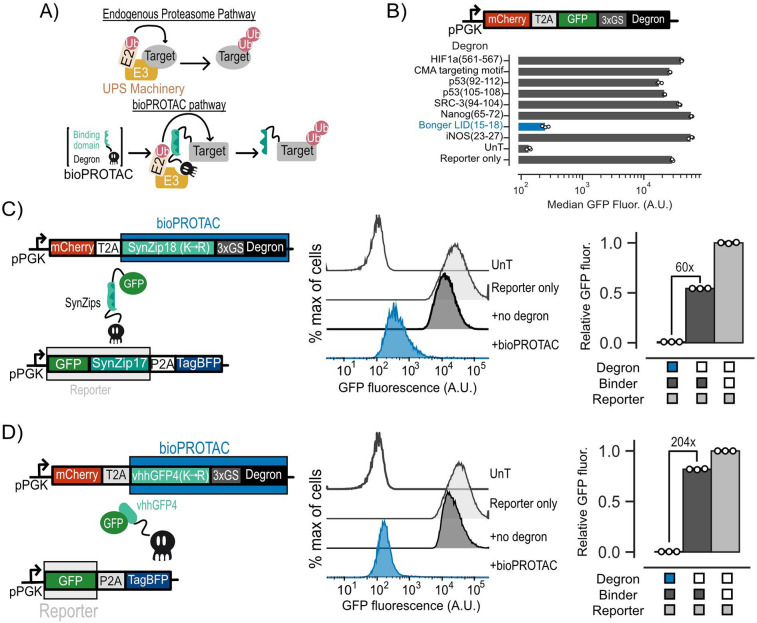
Figure 1. Novel bioPROTACs potently degrade cytosolic proteins in T cells.
(A) Top: Cartoon diagramming abbreviated endogenous proteasomal degradation. Bottom: Cartoon depicting proposed bioPROTAC design and implementation. (B) Top: Cartoon depicting archetype of lentiviral payload used to engineer Jurkat T cells for screening of degrons for bioPROTAC construction. Bottom: Comparison of degron efficacies. Fluorescence was measured by flow cytometry. Dots represent biological replicates and error bars show SEM. (C and D) Left: Cartoons describing lentiviral payloads used to test bioPROTAC efficacy in Jurkat T cells. Middle: Flow cytometry histograms of the diagrammed lentiviral payloads in the left panel alongside controls. Histograms are representative of three independent experiments. Right: Quantification of flow cytometry histograms. Relative GFP fluorescence was calculated by normalizing measured GFP fluorescence by the fluorescence of the reporter only control. Each dot represents a technical replicate and error bars show SEM. Data is representative of three independent experiments.

