
Fig 2. Reduced insulin but not glucagon secretion in all pancreas regions in recent-onset T1D.
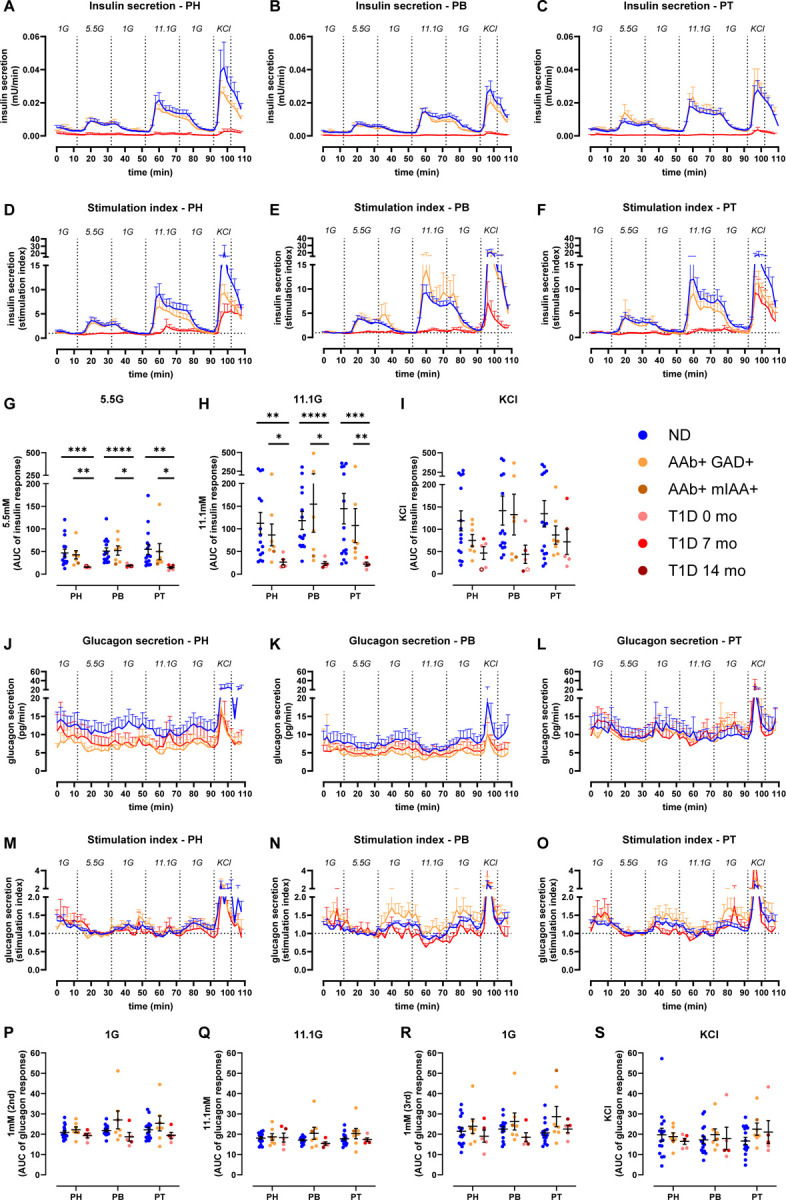
A-C. Insulin secretion from slices of PH (A), PB (B), and PT (C) in slices from ND, 1AAb+, and T1D donors shown as absolute secreted amounts (mU/min).
D-F. Insulin secretion traces from slices of PH (D), PB (E), and PT (F) in slices from ND, 1AAb+, and T1D donors shown as stimulation index calculated as fold of baseline (1G).
G-I. Quantification of insulin responses to 5.5G (G), 11.1G (H), and KCl (I) stimulation.
J-L. Glucagon secretion from slices of PH (J), PB (K), and PT (L) in slices from ND, 1AAb+, and T1D donors shown as absolute secreted amounts (pg/min).
M-O. Glucagon secretion traces from slices of PH (M), PB (N), and PT (O) in slices from ND, 1AAb+, and T1D donors shown as stimulation index calculated as fold of baseline (5.5G).
P-S. Quantification of glucagon responses to 1G (P), 11.1G (Q), 1G (R), and KCl (S) stimulation.
N=15 ND, 7 1AAb+, and 5 T1D donors, with 4 slices/region/donor
Dots represent individual donors. Data are represented as mean ± SEM. Significance was assessed using RM two-way ANOVA of log-transformed data (G-I and P-S). *p < 0.05; **p < 0.01; ***p < 0.001; ****p < 0.0001; ns, not significant.
See also Figures S2 and S3.