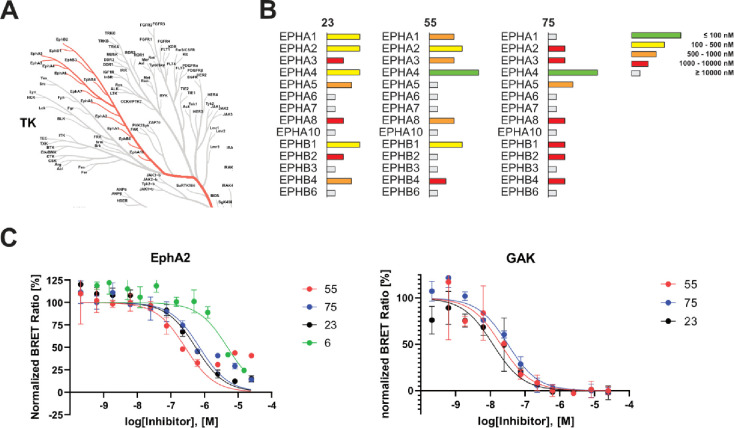
Figure 7.
Evaluation of the key compounds from this SAR study in a cellular context. (A) Phylogenetic kinome tree showing TK-family members. The EPH subfamily is highlighted by red colored branches (figure was created using the CORAL web software). (B) NanoBRET EC50 values for compounds 23, 55, and 75 measured for all 14 EPHs. Values are depicted as horizontal bars and simplified by different lengths and colors (EC50 100 nM (green), 100–500 nM (yellow), 500–1000 nM (orange), 1000–10000 nM (red), and ≥ 10000 nM (gray)). See Table S2 for comoplete data set. (C) Results from the cellular NanoBRET assay, shown as normalized BRET ratio [%] against log(inhibitor) [M] for EPHA2 and GAK. Mean and standard error of the mean (SEM) performed in technical duplicates. The exact number of repeats for each set of experiments is given in Table S2.

