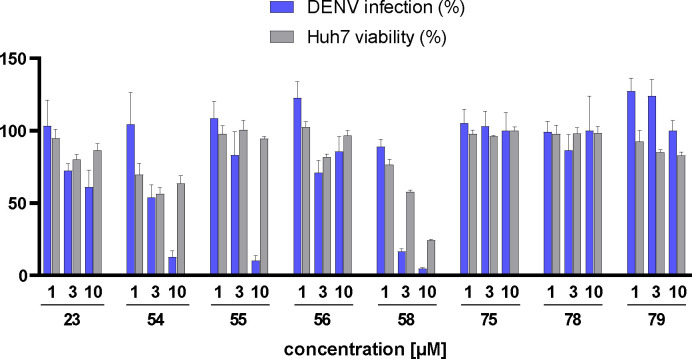
Figure 9.
Antiviral activity of compounds 23, 54, 55, 56, 58, 75, 78, and 79 in a DENV-2 infection assay with Huh7 liver cancer cells. Compounds were tested at three concentrations. Data are represented as bars depicting DENV infection (blue) and cell viability (gray), and mean plus standard deviation (n = 4).

