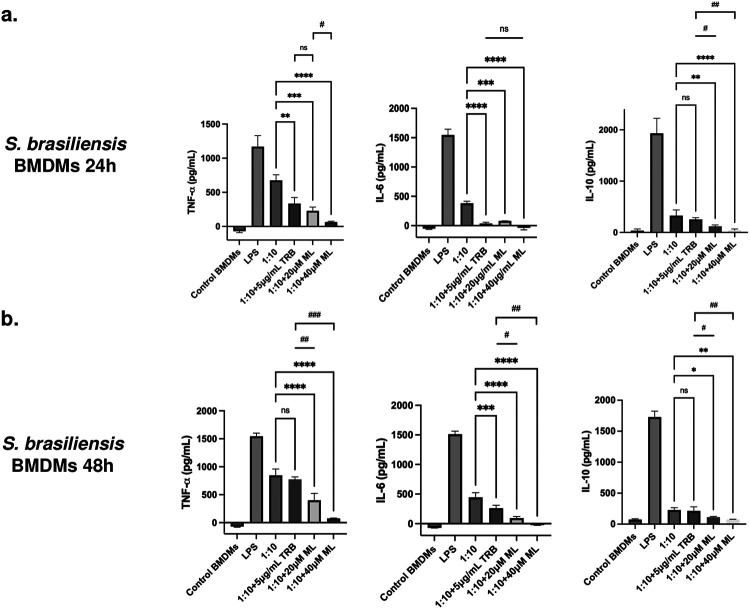
Figure 7. Cytokine secretion by BMDM infected with S. brasiliensis and treated with ML.
a) BMDM cells were infected with S. brasiliensis yeast and treated with ML 20 and 40μg/mL for 24h. The interaction supernatant was collected and the cytokines TNF-α (ns: not significant; **p-value<0.005 when compared to untreated cells; ***p-value<0.0005 when compared to untreated cells; ****p-value<0.0001 when compared to untreated cells; #p-value<0.01 when compared to TRB treatment), IL-6 (ns: not significant; ***p-value<0.0005 when compared to untreated cells; ****p-value<0.0001 when compared to untreated cells), and IL-10 (ns: not significant; **p-value<0.005 when compared to untreated cells; ****p-value<0.0001 when compared to untreated cells; #p-value<0.0005 when compared to TRB treatment; ##p-value<0.0001 when compared to TRB treatment) were measured. b) BMDM cells were infected with S. brasiliensis yeast and treated with 20 and 40μg/mL for 48h. The interaction supernatant was collected and the cytokines TNF-α (ns: not significant; ****p-value<0.0001 when compared to untreated cells; #p-value<0.0005 when compared to TRB treatment; ##p-value<0.0001 when compared to TRB treatment), IL-6 (***p-value<0.001 when compared to untreated cells; (****p-value<0.0001 when compared to untreated cells; #p-value<0.005 when compared to TRB treatment; ##p-value<0.0001 when compared to TRB treatment), and IL-10 (ns: not significant; *p-value<0.05 when compared to untreated cells; **p-value<0.01 when compared to untreated cells; #p-value<0.05 when compared to TRB treatment; ##p-value<0.01 when compared to TRB treatment) were measured.

