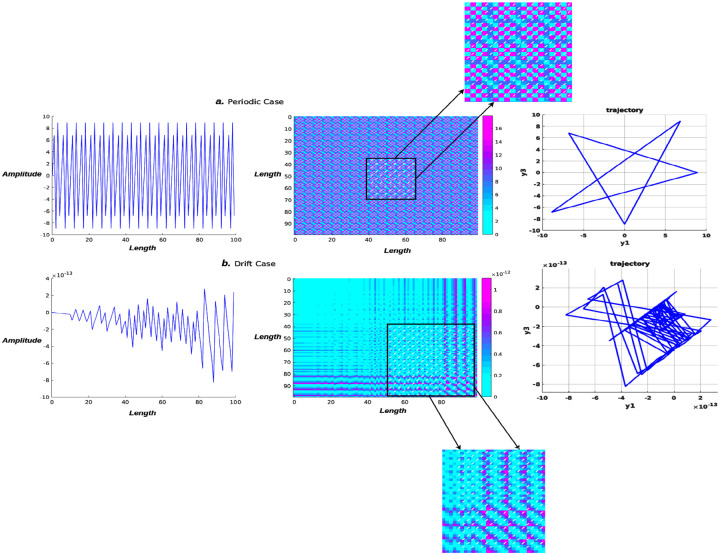
Figure 2: Recurrence plot and phase trajectory visualization.
The periodicity of the neural signal (top row) may be seen in the recurrence plot, which shows the same pattern repeated over and over again in 2D fuzzy recurrences. The drift neural signal (second row), on the other hand, exhibits a completely distinct pattern depending on the time interval. The vertical or horizontal axis denotes a period of time during which the neural state remains constant or changes very slowly. In both cases, phase portraits are plotted, and they all show totally different dynamic trajectories.

