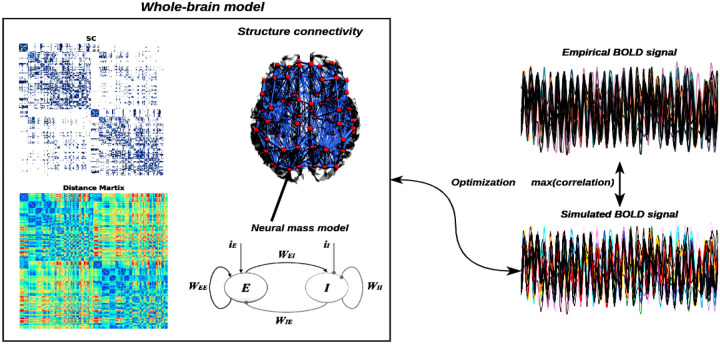
Figure 5: Overview of whole-brain neural mass model.
The left panel shows the large-scale structure connectivity (structure connectivity coupling strength matrix and fiber distance matrix) and neural mass model considered with Excitatory -Inhibition couple networks (e.g., , and external currents input, and ), and the right panel shows the simulation BOLD signal from the neural mass model, which can be optimized for maximum correlation between the empirical and simulated BOLD signal.

