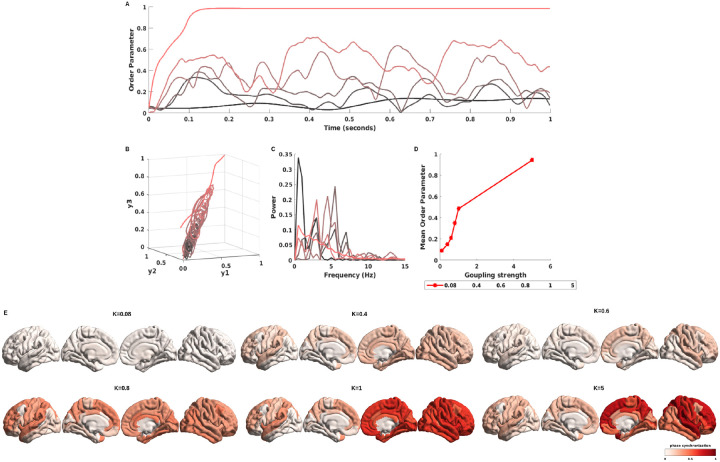
Figure 7: The order parameter of simulated BOLD signals with different coupling strengths.
The A shows the order parameter of simulated BOLD signals with various coupling strengths (from weak coupling strength to high coupling strength, corresponding to dark black lines to red lines) from the Kuramoto model, and B shows the phase portrait of order parameter with simulated BOLD singals with and . The C shows power spectrum corresponding to order parameter of synthetic neural time series. The D shows the mean order parameter under different coupling strengths ([0.08, 0.4, 0.6, 0.8, 1, 5]). The E represented the mapping of phase synchrony to the brain surface and explained how the neural signal synchronized with a varying coupling strength value.

