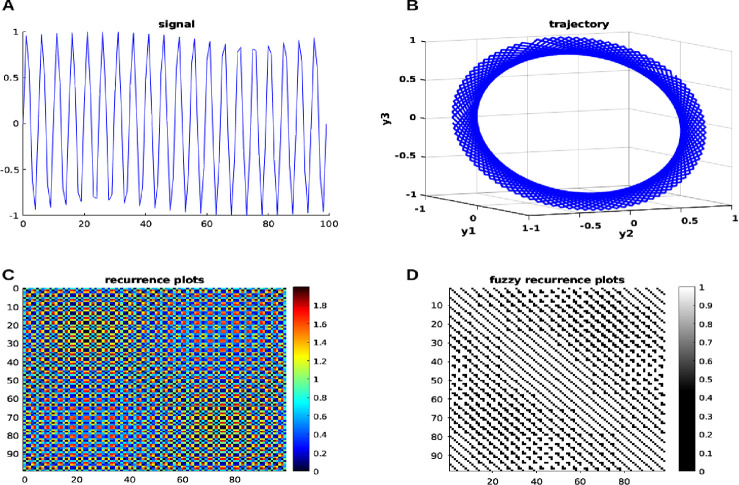
Figure 2: Neural modeling time series with nonlinear dynamics.
The generated neural signals are on the left (A), and the trajectory of the input signal in 3D phase space is on the right (B); the recurrence plots is on the left (C), and the FRP is on the right (D). See the main text for more information.

