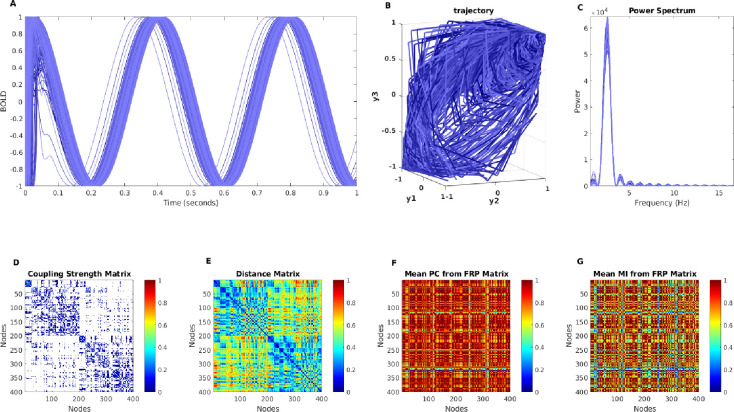
Figure 5: The BOLD simulation with neural mass model.
The A shows the simulated BOLD signals from 400 brain regions with the Kuramoto model, and B shows the phase portrait of simulated BOLD signals with and . The C shows power spectrum corresponding to synthetic neural time series. The empirical structure connectivity (D), empirical fiber distance connectivity (E), and predicted functional connectivity(F,G) are shown in the second row, respectively.

