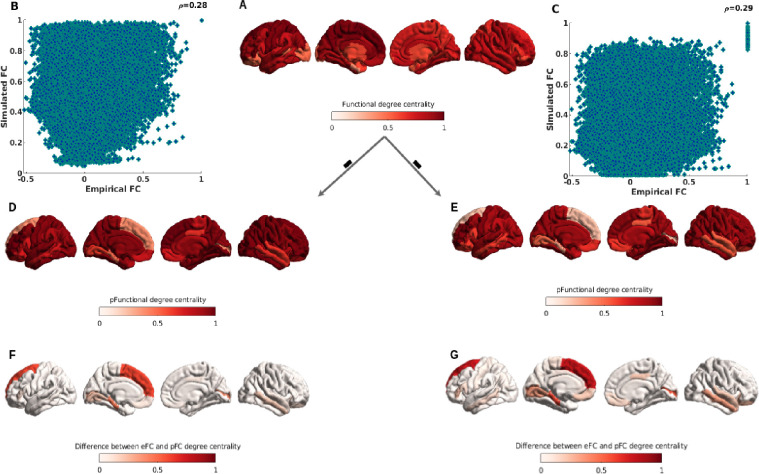
Figure 7: Cortical hubs of empirical functional connectivity, and predicted functional connectivity.
The degree centrality used to identify functional hub regions. A. shows the functional degree centrality with empirical functional connectivity. B. and C. show the correlation between empirical functional connectivity and the mean Pearson correlation of predicted functional connectivity from FRP and the mutual information of predicted functional connectivity from FRP. D. and E. show the predicted functional degree centrality from predicted functional connectivity with mean Pearson correlation and mean mutual information of FRP. F. and G. show the topological difference between empirical and predicted functional degree centrality from correlation of FRP, and mutual information of FRP. See the main text for more information.

