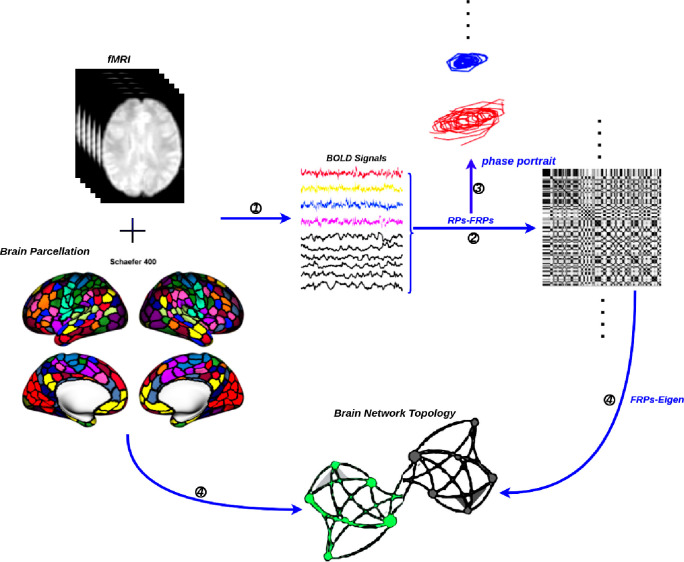
Figure 8: The general flowchart for the construction of a functional brain network by fMRI.
① Time series extraction from fMRI data within each functional unit (i.e., Schaefer’s 400 cortical regions [73]). ② Estimation of a functional connectivity with FRP. ③ Examined the nonlinear properties of time series in the phase plane. ④ Visualization of functional connectivity as a graphs network (i.e., network edges- FRP eigenvalue and network nodes-functional unit).

