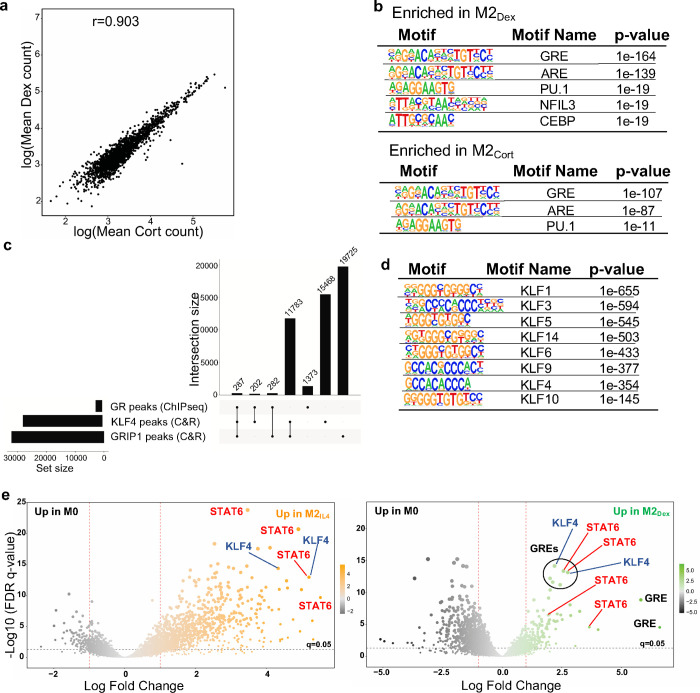
Extended Data Fig. 4: GR, KLF4 and GRIP1 genome-wide binding in differentially polarized macrophage populations.
a Read counts in peaks Spearman’s correlation between M2Dex and M2Cort GR ChIPseq. b Top enriched transcription factor binding motifs in GR ChIPseq peaks in M2Dex and M2Cort. Peaks were analyzed by HOMER2 findMotifsGenome.pl to identify significantly enriched motifs relative to genomic background. c UpSet plot shows GC-induced peaks from GR ChIPseq and the total peak atlases from KLF4 and GRIP1 CUT&RUN as analyzed by BedSect. Set-size: number of total regions (overlaps and unique). Intersection size: number of total regions with specified overlaps. d Enrichment p-values for KLF family motifs in KLF4 CUT&RUN-derived peaks. Peaks were analyzed by HOMER2 findMotifsGenome.pl to identify significantly enriched motifs relative to a set of background regions with similar GC content. e Volcano plots of GRIP1 CUT&RUN differential peaks in M2IL4 (left) and M2Dex (right) relative to M0. Size of the peak point on graph is commensurate with −log10(FDR), whereas color shade is proportional to the log2FC. Peaks were scanned for the presence of transcription factor binding motifs within the HOMER database using motifmatchr and select motifs (GRE, black; STAT6, red; KLF4, blue) are indicated.

