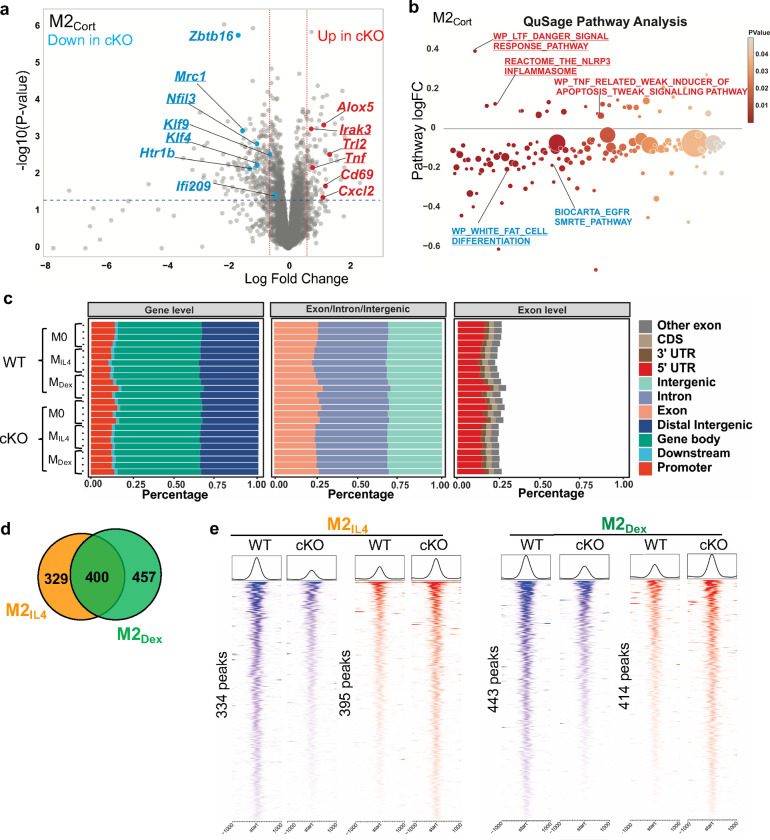
Extended Data Fig. 5: GRIP1 is required for the M2IL4 and M2GC programming.
a Volcano plot shows DEGs in GRIP1 cKO vs. WT in M2Cort relative to M0 of each genotype. (FC ≥1.5; unadjusted p-value<0.05). A subset of DEGs expressed at higher levels in the cKO relative to WT are highlighted in red, whereas those downregulated - in blue. Examples of the shared M2IL4:M2GC GRIP1 target genes are underlined. b Differentially regulated pathways in M2Cort (unadjusted p < 0.01) identified by QuSAGE with MsigDB are shown for GRIP1 cKO vs. WT. Select up- (red) and downregulated (blue) pathways are labeled, and those shared between IL4 and GC are underlined. Circle size is proportional to the number of genes in the pathway and color signifies p-value. c The distribution of ATACseq peaks relative to known genomic features in M0, M2IL4 and M2Dex populations across replicates for WT (n=3) and GRIP1 cKO (n=4). d Venn diagram of GRIP1-dependent differential ATACseq peaks in M2IL4 and M2Dex (n=4, FC ≥ 2; FDR <0.05). e Heatmaps of the GRIP1-dependent ATACseq peaks in M2IL4 and M2Dex (FC ≥ 2; FDR <0.05) are separated into those dependent on GRIP1 for opening (blue) or closing (red).

