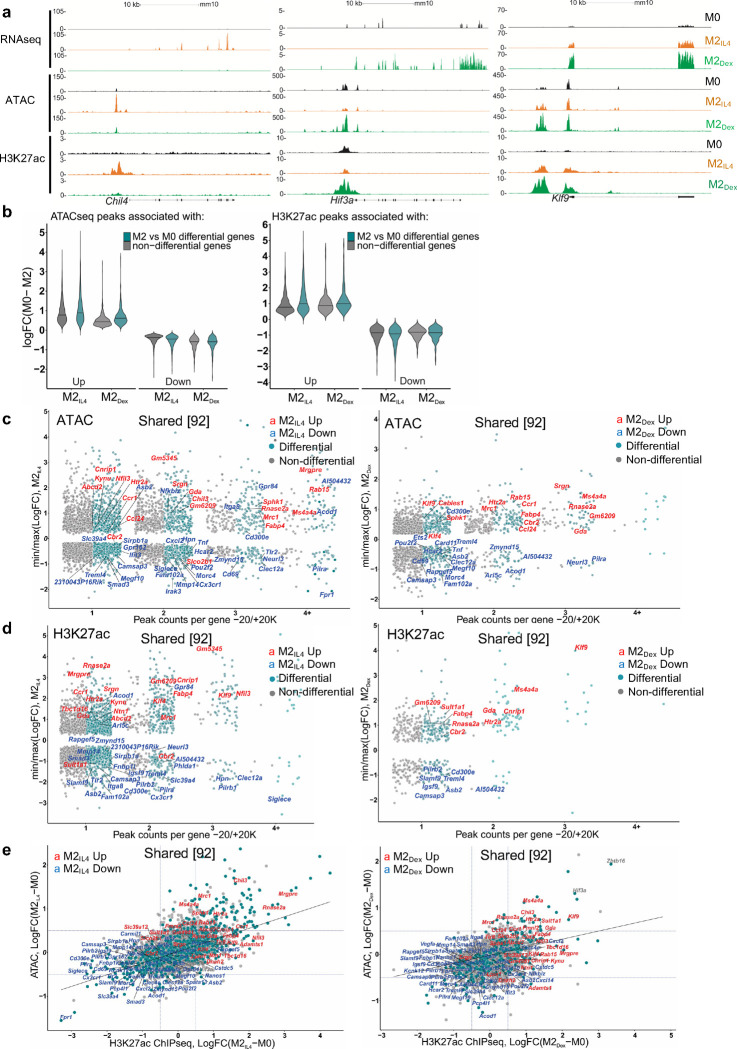
Fig.3 |. M2Dex and M2IL4 have both distinct and shared de novo enhancers as demonstrated by H3K27ac ChIPseq.
a, Correlation between RNAseq, ATACseq and H3K27ac ChIPseq signals in selected M2IL4-specific, M2Dex-specific and shared genes. b, Genome-wide changes in up- or downregulated differential ATACseq (left) and H3K27ac ChIPseq (right) peaks located within −20K +20K window centered on the TSS in M2IL4 and M2Dex, as indicated. c-d, Comparison of TSS window-associated ATACseq (c) or H3K27ac ChIPseq (d) peaks in differential (teal) vs. non-differential (gray) genes in M2IL4 (left panels) and M2Dex (right panels), as indicated, stratified by the number of gene-associated peaks. Only peaks with the largest positive (max) or negative (min) changes relative to M0 are shown. A subset of 92 shared up- (red) and downregulated (blue) DEGs identified by RNAseq (Fig. 1) are labeled in each of the 4 panels. e, Correlation between normalized H3K27ac ChIPseq and ATACseq signals in the TSS-proximal −1K +1K windows for differential (teal) and non-differential (gray) genes. A subset of 92 shared upregulated (red) and downregulated (blue) DEGs identified by RNAseq (Fig. 1) are labeled.

