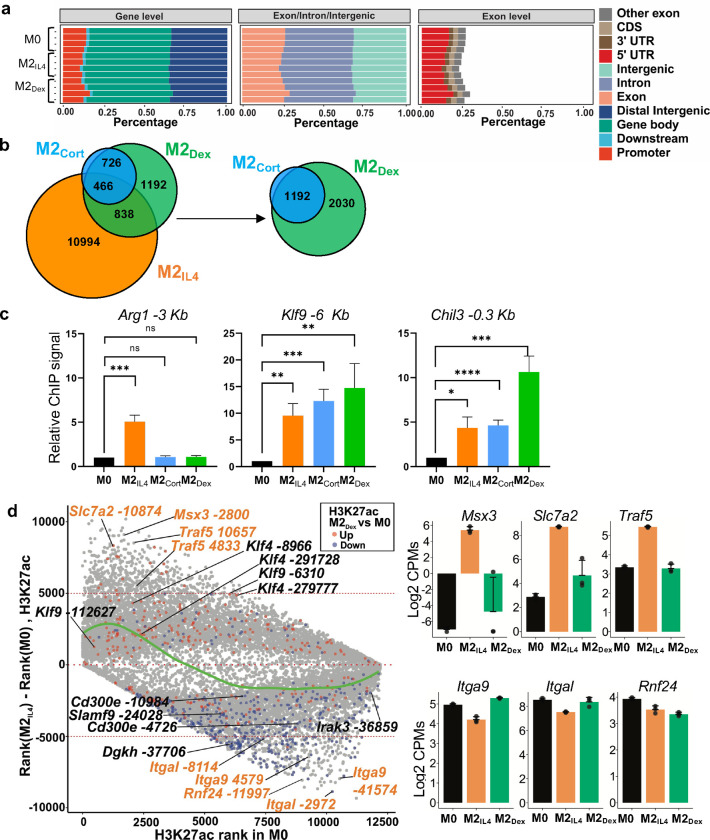
Extended Data Fig. 2: M2IL4 and M2GC macrophage populations share epigenetic landscape.
a The distribution of ATACseq peaks relative to known genomic features in M0, M2IL4 and M2Dex populations across replicates (n=3). b Venn diagram shows differential M2IL4, M2Cort and M2Dex H3K27ac peaks relative to M0. c H3K27ac assessed by ChIP-qPCR at enhancers of indicated genes in 2IL4, M2Cort and M2Dex normalizedto that in M0. Student’s t-test; *p < 0.05, **p < 0.01, ***p < 0.001, ****p < 0.0001, ns, non-significant. n=3, error bars are SEM. d Rank shift analysis of mean H3K27ac signals in M0 (baseline) and M2IL4. Peaks that are also differentially regulated in M2Dex are colored in red (hyperacetylated) and blue (hypoacetylated). The LOESS regression line (green) shows the relationships between acetylation strength in M0 and signal change in M2IL4. Enhancer sites associated with representative IL4-specific (orange) and shared (black) genes are marked, and the expression of representative genes as determined by RNAseq (Fig. 1) is plotted on the right.

