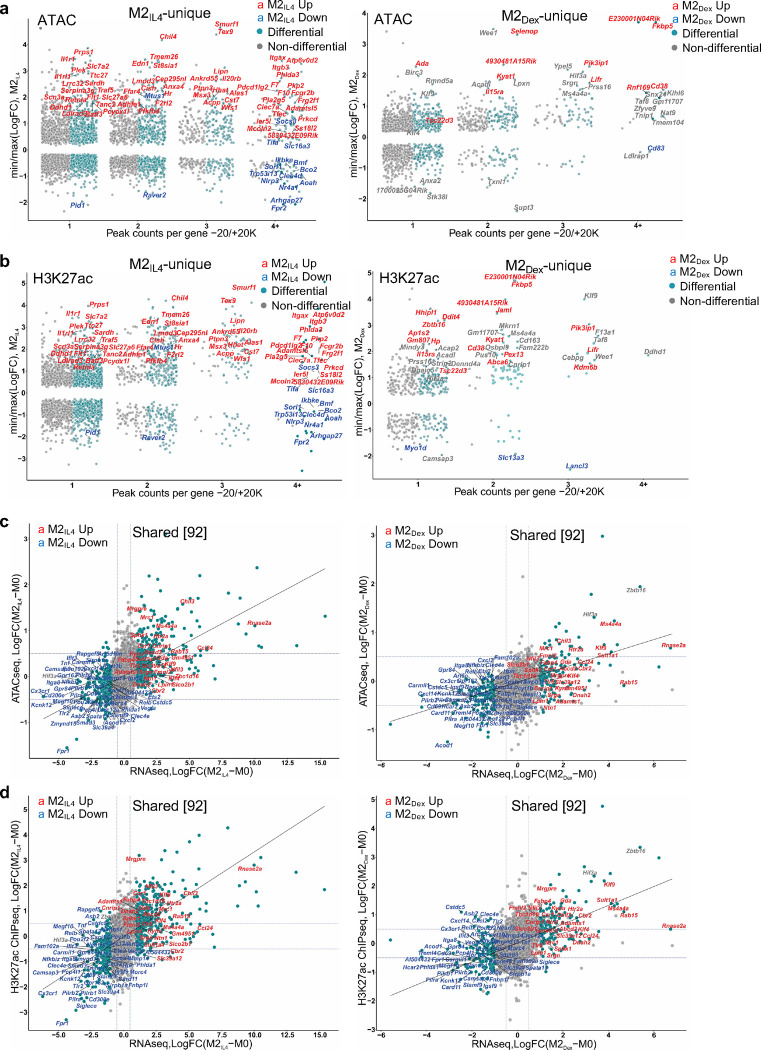
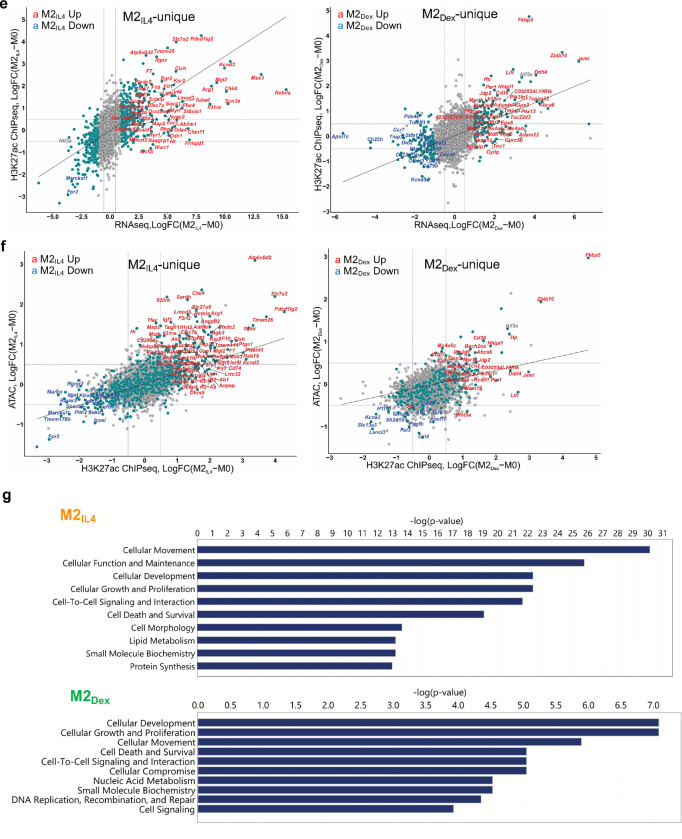
Extended Data Fig. 3: Signal-specific and shared enhancers in M2IL4 and M2GC macrophages.
a-b Comparisons of TSS window-associated ATACseq (a) or H3K27ac ChIPseq (b) peaks in differential (teal) vs. non-differential (gray) genes in M2IL4 (left panels) and M2Dex (right panels) stratified by the number of gene-associated peaks. Only peaks with the largest positive (max) or negative (min) changes relative to M0 are shown. A subset of up- (red) and downregulated (blue) M2IL4-unique (left) and M2Dex-unique (right) DEGs identified by RNAseq (Fig. 1) are labeled. c-d Correlations between normalized RNAseq and ATACseq (c) or H3K27ac ChIPseq (d) signals in the TSS-proximal − 1K + 1K windows for differential (teal) and non-differential (gray) genes in M2IL4 (left) and M2Dex (right). A subset of 92 shared up- (red) and downregulated (blue) DEGs identified by RNAseq (Fig. 1) are labeled. e-f Correlations between normalized RNAseq and ATACseq (e) or ATACseq and H3K27ac ChIPseq (f) signals in the TSS-proximal −1K + 1K windows for differential (teal) and non-differential (gray) genes in M2IL4 (left) and M2Dex (right). A subset of the up- (red) and downregulated (blue) 587 M2IL4-unique DEGs (left) or 174 M2Dex-unique DEGs identified by RNAseq (Fig. 1) are labeled. g Differentially regulated pathways identified by Ingenuity Pathway Analysis (QIAGEN) of genes associated with change in both the ATACseq and H3K27ac ChIPseq signal in M2IL4 and M2Dex populations.


