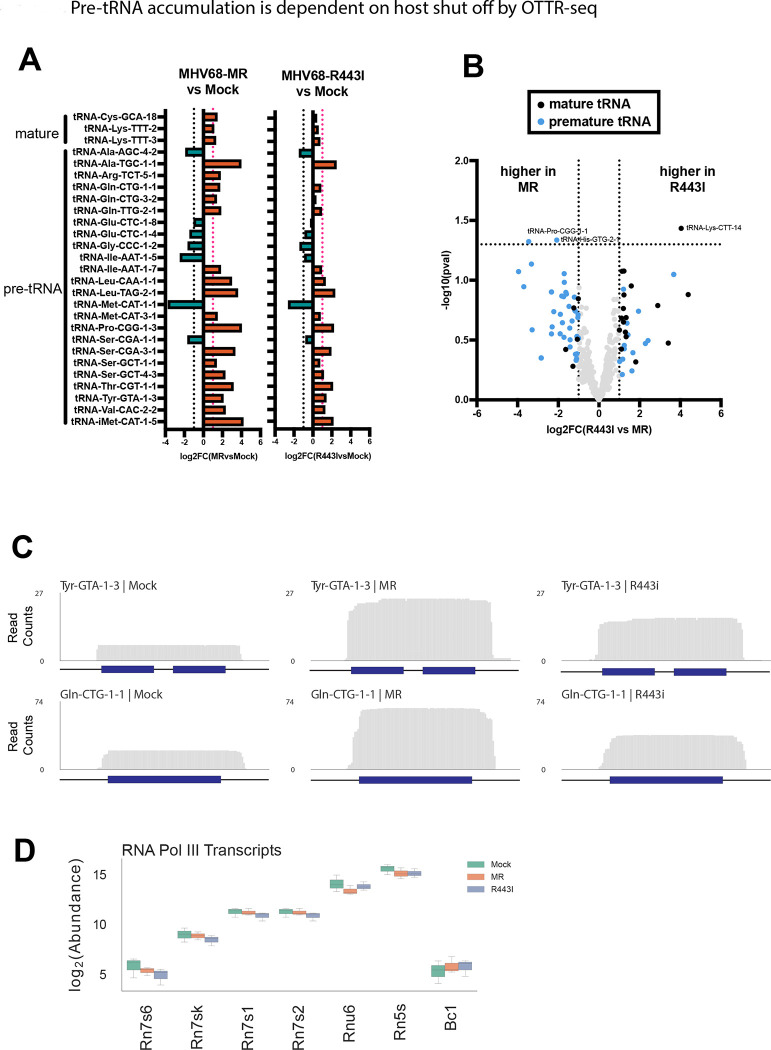
Figure 3. Pre-tRNA accumulation is dependent on host shut off by OTTR-seq.
(A) Log2(fold-change) values of MHV68 infected (left) or R443I (right) versus Mock infection for differentially expressed host mature and premature tRNAs (p<0.05). Horizontal dotted lines indicate a fold change of > or < 2. (B) Volcano plot of log2(fold-change or FC) values for full-length tRNAs from MHV68-MR vs. -R443I infections, plotted against -log10(pval). tRNAs with fold changes > 2 are colored blue for pre-tRNAs or black for mature tRNAs. (C) Normalized read coverage (5’ -> 3’) from Mock (left), MR (middle), or R443I (right) across the Tyr-GTA-1–3 (top) and Gln-CTG-1–1 (bottom) tRNA gene loci. Dark blue boxes correspond to the gene body of the tRNA, while the horizontal black lines correspond to the 30 bp upstream, 30 bp downstream, and/or intronic regions. (D) Box plot showing the log2(abundance) of seven RNA polymerase III transcripts colored by infection conditions.

