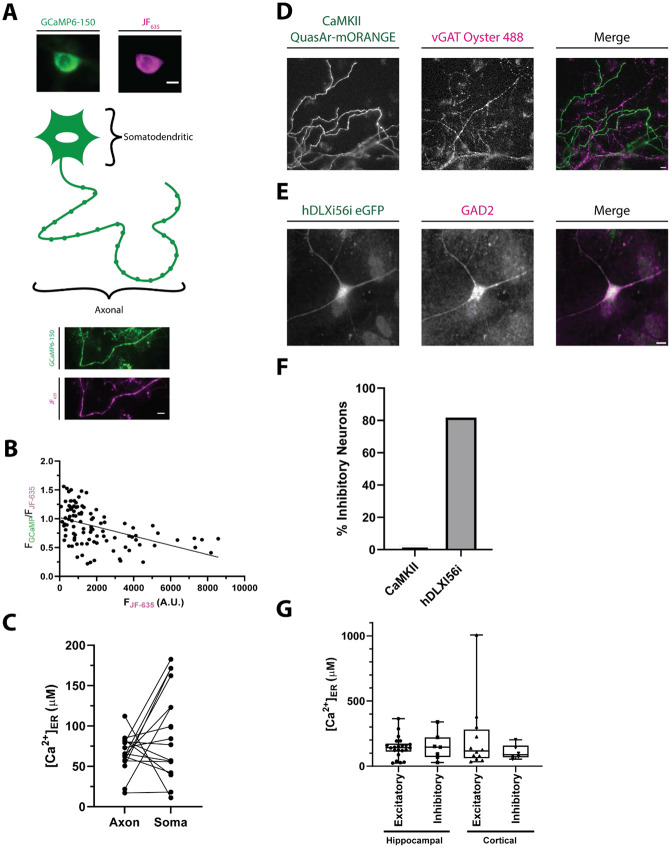
Figure 3 -. Comparisons of neuronal ER .
A) Schematic with sample widefield images of the ER-Halo-GCaMP6-150 loaded with JF635. The somatic (top) and axonal (bottom) ER compartments that were compared in B) are highlighted. (ER-GCaMP6-150 is green and the JF635 is magenta). Scale bar is 10 μm.
B) Plot of the ratio of the ER-GCaMP6-150 signal to the JF-Halo bound fluorescence signal as a function of the total JF635 Halo-bound fluorescence signal measured over a large population of individual hippocampal cell somas. (n = 101 cells). The expression level of the indicator is weakly correlated with the ratio reporting the ER level as reported by a linear fit (line, R2 = 0.22).
C) Comparison of ER [] in the soma and axonal regions of the same neurons. (n = 16, n.s. p > 0.05, Welch’s t-test)
D) Representative image showing the specificity of the CaMKII promoter for excitatory neurons. Neurons are transfected with QuasAr-mORANGE under the CaMKII promoter. Following stimulation in the presence of a luminal vGAT antibody, inhibitory nerve terminals are labeled. Scale bar is 10 μm.
E) Representative immunostaining showing the specificity of the hDLXI56i enhancer for inhibitory neurons. Neurons are transfected with eGFP under the hDLXI56i enhancer which can be recognized by a GFP antibody. GAD2 labels inhibitory neurons. Scale bar is 10 μm.
F) Quantification of the percentage of inhibitory neurons for the CaMKII promoter (1/36 cells, 2.8%) and the hDLXI56ienhancer (18/22 cells, 81.8%).
G) Comparison of ER levels between inhibitory and excitatory neurons of both the cortex and hippocampal regions of the rat brain. (Excitatory hippocampal n = 22; inhibitory hippocampal n = 7; excitatory cortical n = 12; inhibitory cortical: n = 6; all comparison n.s. p > 0.05, Kruskal-Wallis)

