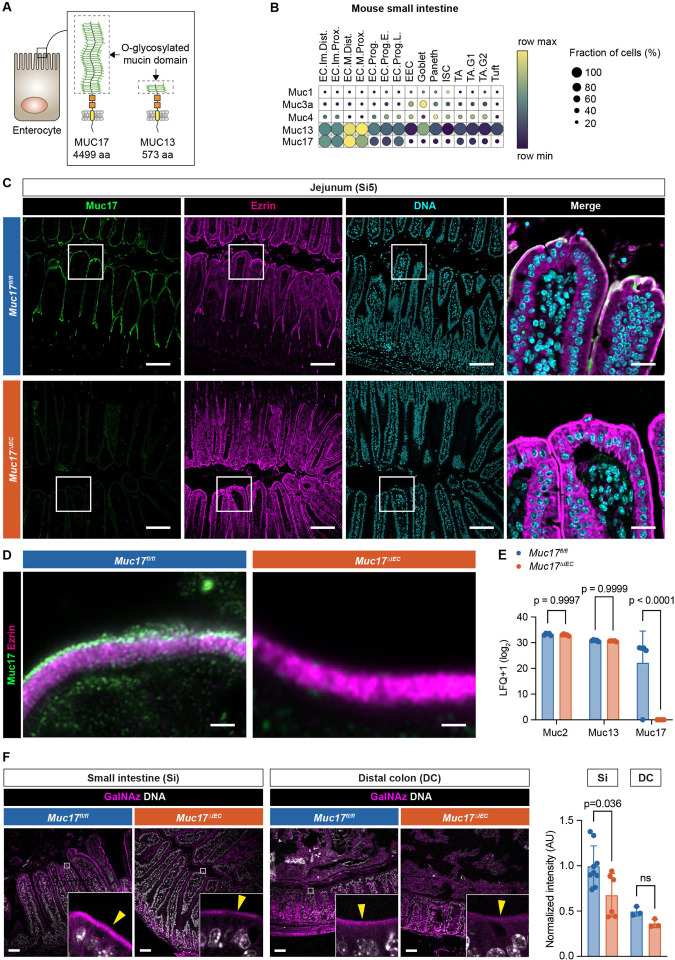
Fig. 2. Epithelial-specific deletion of Muc17 results in the loss of Muc17 expression in the mouse small intestine.
(A) Schematic illustration of murine Muc17 and Muc13. Dashed boxes show the O-glycosylated mucin domain in each mucin. aa, amino acids. (B) Expression of membrane mucin transcripts in epithelial cell types of the mouse small intestine. The color scheme shows row maximum and minimum representing the relative expression of each gene among all cell types. EC, enterocyte; EEC, enteroendocrine cell; ISC, intestinal stem cell; TA, transit amplifying; Im, immature; M, mature; Prox, proximal; Dist, distal; Prog, progenitor; E, early; L, late; G1, G1-phase; G2, G2-phase of cell cycle. (C) Immunohistochemistry of Muc17 (green), Ezrin (magenta), and DNA (cyan) in histological sections of the jejunum (Si5) from Muc17fl/fl and Muc17ΔIEC mice. Scale bar 50 μm. Scale bar in insets 10 μm. (D) Airyscan high-resolution microscopy of Muc17 (green) and Ezrin (magenta) in the small intestinal brush border of Muc17fl/fl and Muc17ΔIEC mice. Scale bar 1 μm. (E) Bar graph representing the abundance of detected mucins in the proteome of small intestinal epithelial cells from Muc17fl/fl and Muc17ΔIEC mice. n= 5 for each group. (F) Representative confocal micrographs of small intestine (Si) and distal colon (DC) from Muc17fl/fl and Muc17ΔIEC mice, stained for bioorthogonally labeled O-glycans (GalNAz, magenta) and DNA (white). Scale bar 50 μm. Bar graphs represent the quantification of GalNAz intensity in the apical brush border of the small intestine (Si) and DC in each group. Si5: n=6–9 per group. DC: n=3 per group. Significance was determined by two-way ANOVA followed by Šidák correction (D) and Mann-Whitney test (E).

