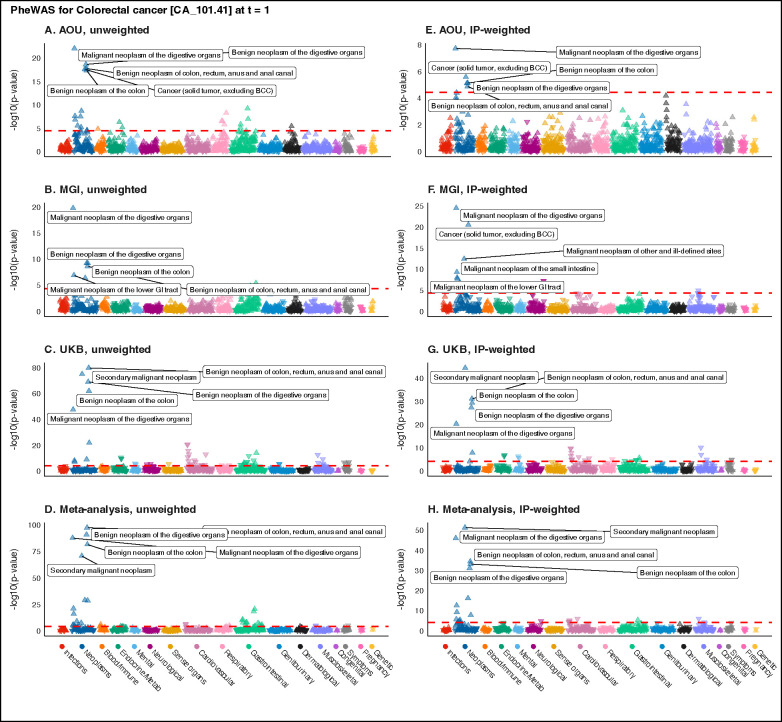
Figure 4.
Manhattan plots summarizing unweighted (panels A-C) and inverse probability (IP)-weighted (panels E-G) phenome-wide association studies (PheWAS) for colorectal cancer in All of Us, the Michigan Genomics Initiative, and UK Biobank using 1:2 case:non-case matched data restricted to one year prior to initial diagnosis. Panels D and H show the unweighted and IP-weighted meta-analysis PheWAS, respectively. The dashed red line represents the Bonferroni-corrected p-value threshold (−log10(0.05/number of traits)). The five traits with the smallest p-values are labeled. The upward (downward) orientation of the triangle indicates a positive (negative) association. Plots corresponding to poststratification-weighted PheWAS are presented in supplementary Figure S12.

