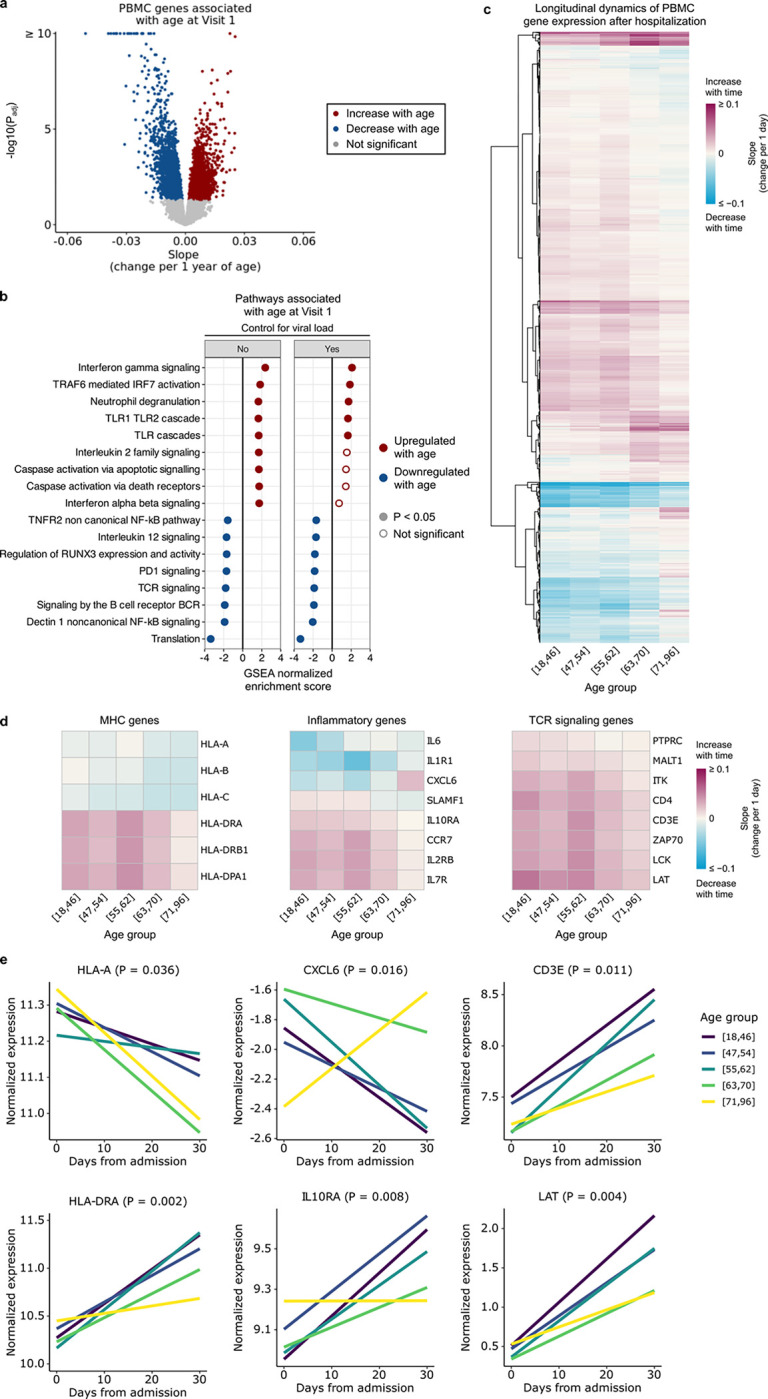
Fig. 4: Aging leads to changes in PBMC gene expression during COVID-19.

(a) Volcano plot highlighting genes associated with age at Visit 1 in PBMC RNA-seq data. (b) Plot demonstrating the normalized enrichment score of select Reactome pathways associated with age at Visit 1, with and without controlling for viral load, in PBMC samples. (Full results are tabulated in Supp. Data 1 and 2.) P values in (a, b) were calculated with limma’s linear model and Benjamini-Hochberg correction. (c) Heatmap representing the temporal slopes (i.e., change in gene expression per 1 day) of 2,812 genes that differ longitudinally between the 5 age groups (adjusted P < 0.05). (d) Heatmaps representing the temporal slopes of select MHC, inflammatory, and TCR signaling genes from (c). (e) Plots demonstrating the temporal dynamics of 6 example genes from (g). P values were calculated using linear mixed effects modeling and Benjamini-Hochberg correction. (Full temporal dynamics plots with confidence intervals are provided in Supp. Fig. 6.)
