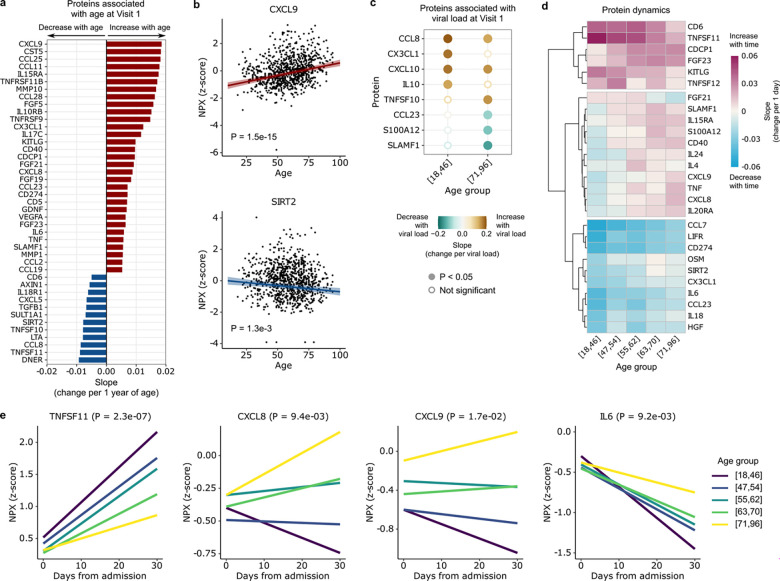
Fig. 5: Aging leads to differences in cytokine and chemokine levels during COVID-19.
(a) Bar plot highlighting proteins that are upregulated (red) or downregulated (blue) with age at Visit 1 (adjusted P < 0.05). (b) Scatter plots of the normalized protein expression (NPX) of representative proteins, CXCL9 and SIRT2, as a function of age. P values are calculated using linear regression and Benjamini-Hochberg correction. (c) Dot plot representing the slope of cytokine expression versus viral load in the youngest and oldest age quintiles, [18,46] and [71,96], respectively. (d) Heatmap depicting temporal slopes (i.e., change in protein expression per 1 day) of all cytokines that display age-dependent longitudinal dynamics (adjusted P < 0.05). (e) Plots showing the temporal dynamics of 4 example cytokines from (d). P values in (d, e) are calculated using linear mixed effects modeling and Benjamini-Hochberg correction.

