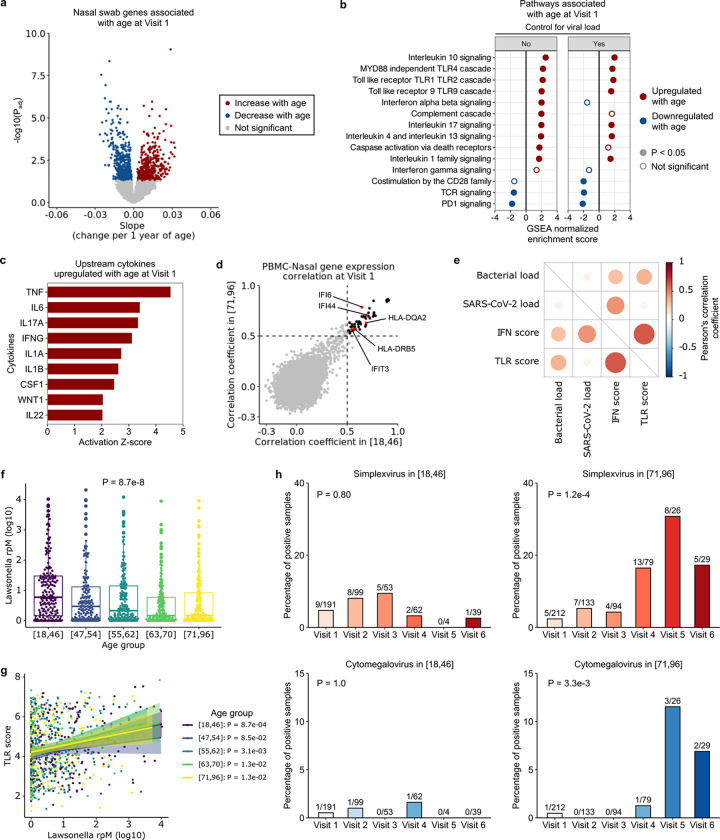
Fig. 6: Aging changes upper respiratory tract gene expression and the airway microbiome in COVID-19.
(a) Volcano plot depicting genes associated with age at Visit 1 in nasal swab metatranscriptomics data. (b) Normalized enrichment scores of select Reactome pathways associated with age at Visit 1, with (right) and without (left) controlling for viral load, in nasal samples. (c) Bar plot depicting cytokines predicted by Ingenuity Pathway Analysis to be upregulated with age in nasal samples. (d) Scatter plot depicting the Pearson’s correlation coefficient of gene expression between PBMC and nasal samples. Each dot indicates the correlation coefficient between PBMC expression and nasal expression of a gene, in the youngest (x-axis) and oldest (y-axis) age group. The black dots mark the genes with correlation coefficients > 0.5 in both age groups (n = 52 genes). (e) Dot plot highlighting correlations between SARS-CoV-2 viral load (log-transformed reads per million (rpM)), total bacterial abundance (log-transformed rpM), interferon stimulated gene (ISG) expression score and Toll like receptor (TLR) gene expression score. (f) Relative abundance of Lawsonella (rpM) across the age quintiles. In (f, g), P values were calculated with one-way ANOVA test. (g) Correlation between Lawsonella relative abundance and TLR gene expression across the age quintiles. P values were calculated using the test of association with Pearson’s correlation coefficient and adjusted with Benjamini-Hochberg correction. (h) Percentages of cases with herpes simplex virus (HSV) or cytomegalovirus (CMV) transcript detection in the youngest versus oldest age quintiles. The number on top of each bar indicates the number of positive cases over the number of total samples. P-values were calculated by Fisher exact test.

