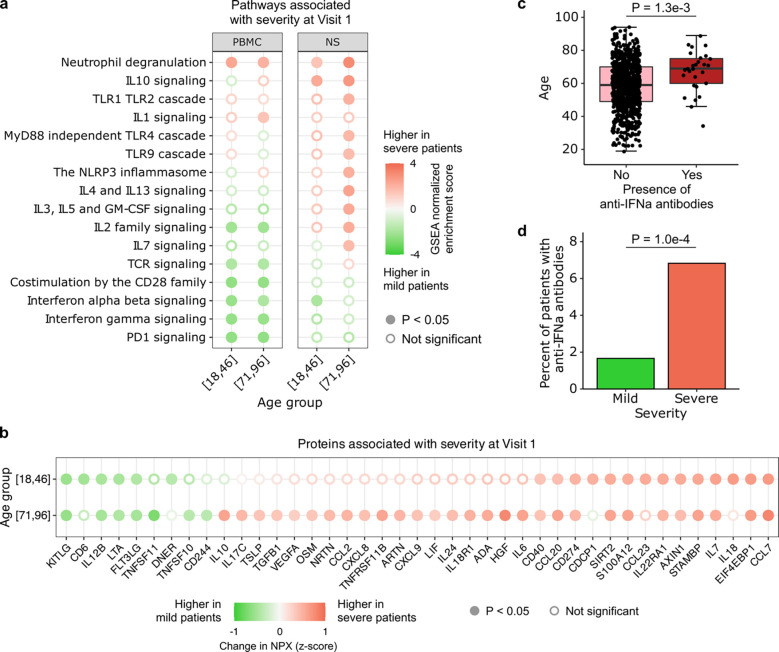
Fig. 7: Aging and COVID-19 severity.
(a, b) Dot plots highlighting a) select Reactome pathways in PBMC or nasal RNA-seq data, and b) serum proteins (Olink) that were upregulated in severe participants (baseline respiratory severity ordinal scale 5–6) compared to mild/moderate (ordinal scale 3–4) participants at Visit 1, stratified by age group (youngest or oldest). P values in (a, b) were calculated with linear modeling and Benjamini-Hochberg correction. (c) Box plot demonstrating association between age and presence of anti-IFN-α autoAbs in the 835 participants with available autoAb data at Visit 1. P value was calculated with the Wilcoxon rank-sum test. (d) Bar plot demonstrating the percentage of severe and mild/moderate participants who had anti-IFN-α antibodies (9/542 participants, 1.66% in mild/moderate; 20/293 participants, 6.83% in severe). P-value was calculated using the Chi-squared test.

