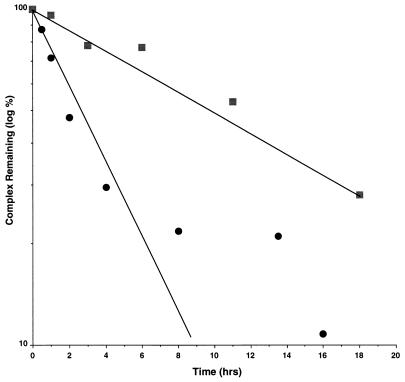
FIG. 5.
Dissociation of His6-Rbl2p–β-tubulin and α-His6–β-tubulin in vitro. The dissociation rates of these two complexes were measured by incubating cell extracts with Ni-NTA beads, resuspending the beads in PME buffer at 4°C, and then measuring the levels of the complexes remaining at various times by immunoblotting. The data are reported as semi-log plots of β-tubulin (circles) and α-tubulin (squares) dissociation. Extracts from cells expressing either Tub2p and His6-Rbl2p or His6-Tub2p alone were used to measure the dissociation of β-tubulin or α-tubulin, respectively.

