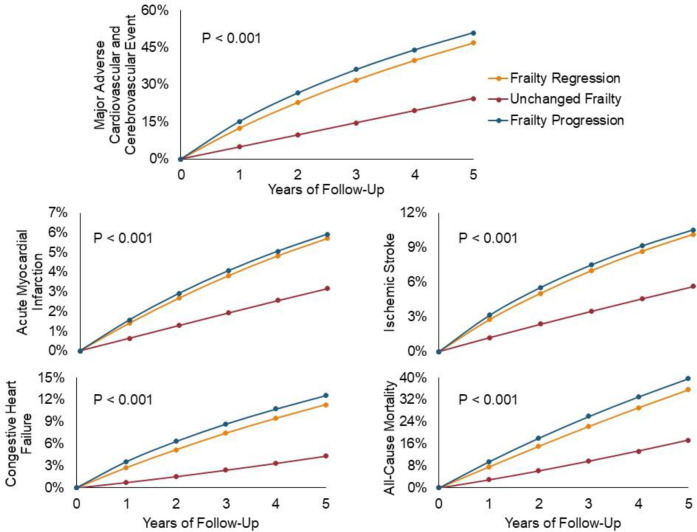
Figure 2. Cumulative Incidence of All-cause Mortality and Cause-specific Hospitalizations for Frailty Progression versus Regression.
Cumulative incidence functions are shown for all outcomes, stratified by frailty trajectory. Frailty progressors (blue line) were defined as claims-based frailty index (CFI) slope > 0.09, frailty regressors (yellow line) were defined as CFI slope < 0.09, and those with unchanged frailty (red line) as slope = 0.09.

