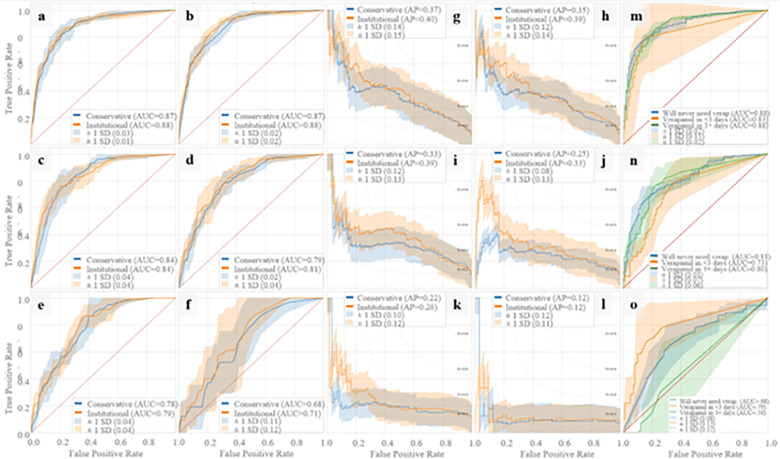
Figure 1. Prospective Model AUC and PR Curves.
Prospective model ROC and PR curves using five-fold cross validation. Binary prospective model results predicting CVRV or not during admission are shown in a-l. Panels a-f and g-l are AUCs and PR curves, respectively, using 4 hours, 1 day, 3 days, 5 days, 7 days, and 10 days of ICU data since ICU admission. Trinary prospective model results predicting CVRV in <=3 days, CVRV in >3 days, or no CVRV during admission, are shown in panels m-o, which show AUC curves using 1 day, 5 days, and 10 days of ICU data since ICU admission.

