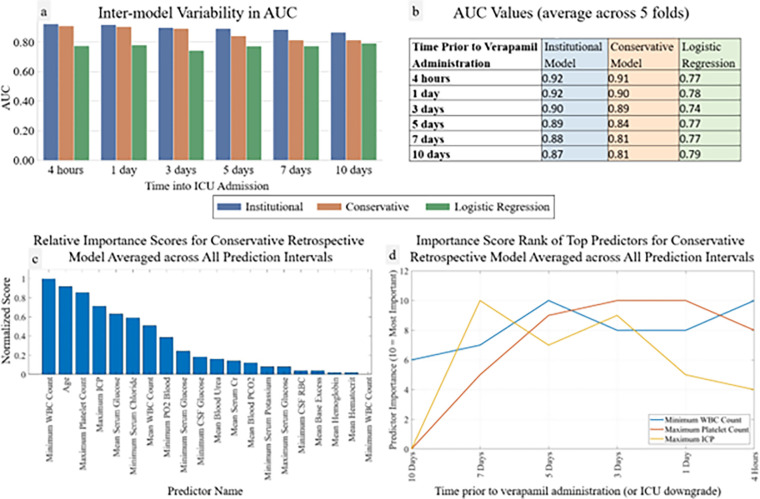
Figure 4. Retrospective Model and Logistic Regression AUCs and Importance Scores.
Retrospective institutional, conservative, and control (logistic regression) models AUCs over time alongside retrospective conservative model importance score analysis. Panels a and b display AUCs at each prediction timepoint for each model (a graphically, b in table format). Panels c and d show importance score analysis: c shows averaged ranked variable importance scores over all prediction timepoints and d shows temporal fluctuation in importance of the three predictor variables with the overall highest variable importance scores (10 = #1 overall predictor, 9 = #2 overall predictor, etc).

