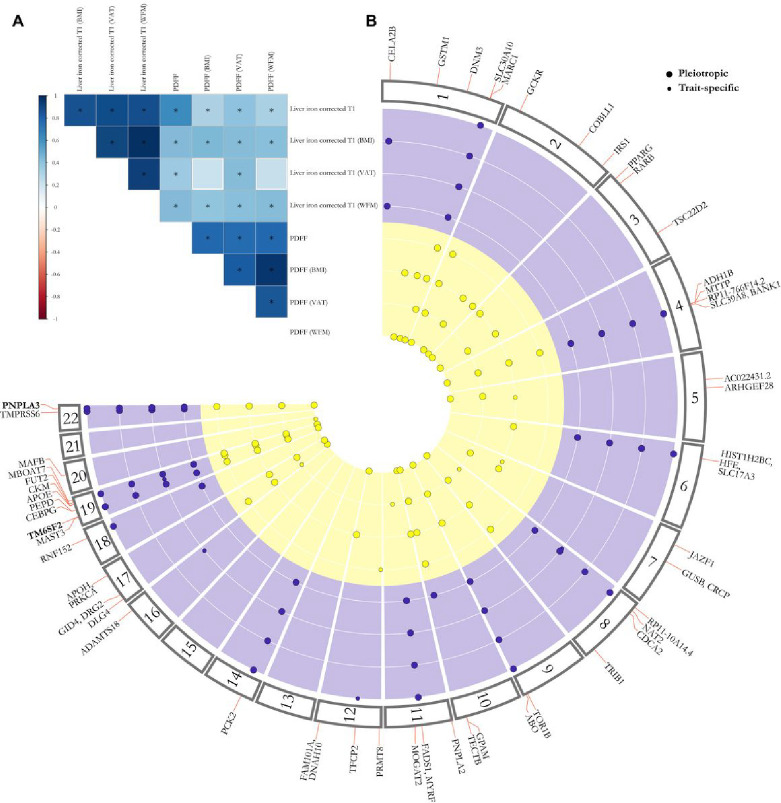
Figure 2: (A) BMI and whole-body fat mass (WFM) have the highest genetic correlation with liver triglycerides content (PDFF) and inflammation (cT1), and (B) 37 for liver triglycerides and 18 for liver inflammation independent loci were found by the multi-adiposity-adjustment GWAS.
(A) Genetic correlation among different multi-adiposity-adjusted PDFF and liver iron corrected T1 was estimated using LD score regression analysis. The asterisks denote Benjamini-Hochberg False Discovery Rate (FDR) < 0.05. The colour bar represents the genetic correlation values. Detailed summary statistics for genetic correlations have been reported in Supplementary Table 2. (B) Circular Manhattan plot of PDFF and liver iron corrected T1 for different adiposity adjustments. Each dot represents an independent genetic locus. The yellow represents lociassociated with liver PDFF and purple those associated with liver cT1. Large dots represent pleiotropic loci, namely loci where the association with either PDFF or liver cT1 was shared among two or more adiposity adjustments. Small dots show adiposity-trait specific associations. Locin bold are shared among both traits irrespective of the adiposity adjustment. Only loci with a genome-wide significant p-value < 5E-8 calculated by whole-genome regression model (see methods) are shown. P-values were not corrected for multiple testing among 4 different models (unadjusted, adjusted for BMI, WFM and VAT). VAT: Visceral adipose tissue; WFM: Whole body fat mass (kg/m2).

