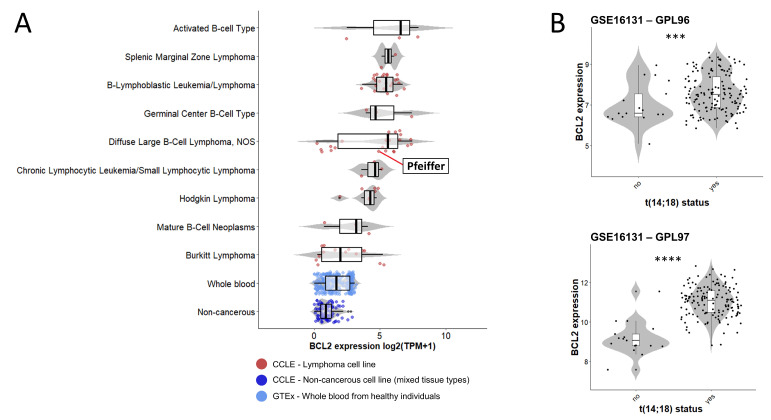
Figure 2.
BCL2 gene expression in lymphoma cell lines and patients. BCL2 expression range in different lymphoma cell lines from the Cancer Cell Line Encyclopedia (CCLE), highlighting the Pfeiffer cell line. Expression of BCL2 is also shown in non-cancerous cell lines of various tissue types (CCLE) and in whole blood from healthy individuals (GTEx database). Expression values are retrieved from RNA sequencing in the units of log2(TPM + 1). Boxplots and violin plots summarize data distribution with dots representing individual cell lines or samples, which are color-coded by sample type (A). BCL2 expression in RNA units in patients with diffuse lymphoma with and without t(14;18) from two microarray experiments (GPL96 and GPL97) downloaded from GSE16131. Boxplots and violin plots summarize data distribution with dots representing individual patient samples. Statistical significance is calculated by T test with p values ≤ 0.0001 (***), and 0.00001 (****) (B).

