Figure 3.
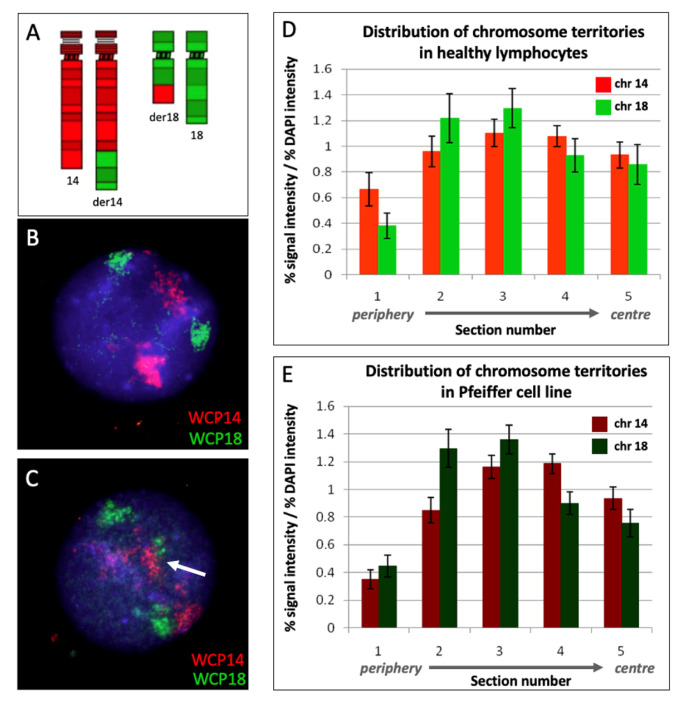
Distribution of territories of chromosomes 14 and 18 within interphase nuclei of Pfeiffer cells and healthy lymphocytes. Combination of whole chromosome paint FISH probes for chromosomes 14 (red) and 18 (green) (A); example of lymphocyte interphase nucleus used as a control showing distinct territories for chromosomes 14 and 18, respectively (B); example of Pfeiffer interphase nucleus showing the fusion of the chromosome territories in der(14) indicated by the white arrow (C); erosion analysis of the distribution of chromosome territories in lymphocytes from healthy donors (D); and erosion analysis of the distribution of chromosome territories in the Pfeiffer cell line (E). The bars are the mean of more than 50 nuclear images analyzed with the erosion script. The error bars are the standard error of the mean. Chromosome 14 and chromosome 18 did not show statistically significant differences in their nuclear location in the Pfeiffer cells compared to the controls (p > 0.05).

