Figure 4.
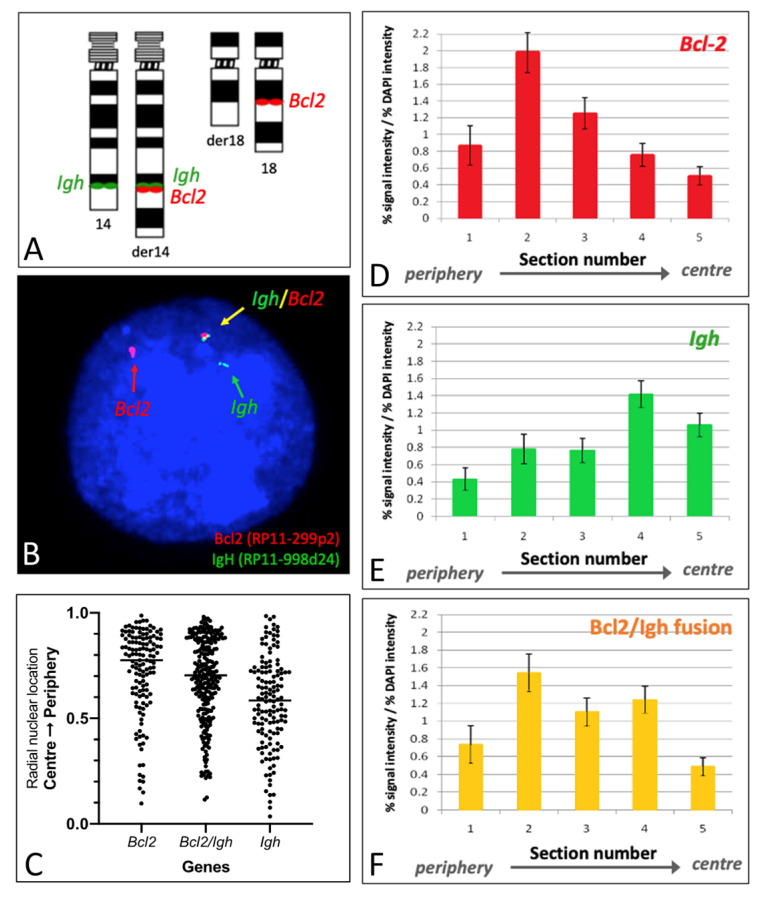
Nuclear localization of BCL2 and IGH genes in Pfeiffer nuclei. Ideogram to show chromosomal locations of the FISH probes used for the BCL2 (red dots) and IGH (green dots) loci (A). Pfeiffer cell line nucleus hybridized with the probe combination shown in panel A, which allows the visualization of the non-translocated BCL2 in red (indicated by a red arrow), the non-translocated IGH in green (indicated by a green arrow), and the fusion signal, red and green close to each other, corresponding to the BCL2::IGH fusion (indicated by a yellow arrow) (B). Radial nuclear positioning, obtained by a statistical analysis distribution of a hundred signals, shows localization of the wild-type BCL2 allele towards the periphery of the nucleus, whereas the positioning of the wild-type IGH allele is more central, and the fusion BCL2::IGH shows a bimodal distribution within two main areas, in the periphery and closer to the center of the nucleus, respectively (C). The erosion analysis shows the positioning of the wild-type BCL2 allele towards the nuclear periphery, mainly in zone 2 (D), positioning of the wild-type IGH allele towards the inner/intermediate portion of the nucleus, mainly in zone 4–5 (E), and a fusion signal corresponding to the BCL2::IGH fusion occupying prevalently zone 2 and zone 4, mimicking the positioning of both wild-type alleles (F). The bars are the mean of more than 50 nuclear images analyzed with the erosion script. The error bars are the standard error of the mean.

