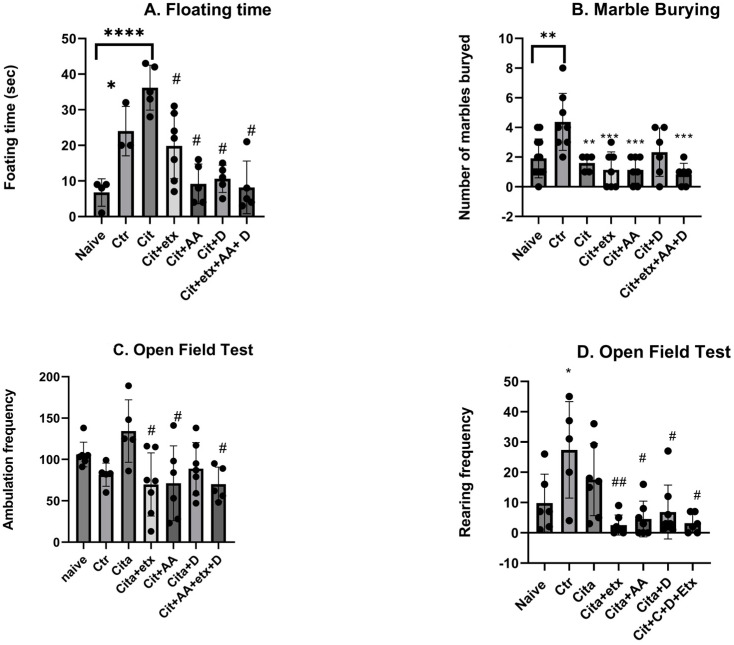
Figure 1.
(A) floating time among the different groups. ANOVA followed by Tukey’s post hoc analysis. Values are expressed as the mean SEM (ANOVA followed by Tukey’s test). F(6, 27) = 12.48; p < 0.0001. * p < 0.05, **** p < 0.0001 vs. naive and # p < 0.00001 vs. citalopram. Ctr: control; Cit: citalopram; etx: etifoxine; D: vitamin D; AA: ascorbic acid; SEM, standard error of the mean. (B) The number of buried marbles in the group ANOVA followed by Tukey’s post hoc analysis. Values are expressed as the mean SEM (ANOVA followed by Tukey’s test). F(6, 44) = 6.29; p = 0.0001. ** p <0.05; *** p < 0.001 vs. control. Ctr: control Cit: citalopram; etx: etifoxine; D: vitamin D; AA: ascorbic acid; SEM, standard error of the mean. (C) The ambulation frequency per group ANOVA followed by Tukey’s post hoc analysis. Values are expressed as the mean SEM (ANOVA followed by Tukey’s test). F(6, 35) = 3.19; p = 0.001; # p < 0.05 vs. citalopram. Ctr: control Cit: citalopram; etx: etifoxine; D: vitamin D; AA: ascorbic acid; SEM, standard error of the mean. (D) The rearing frequency per group ANOVA followed by Tukey’s post hoc analysis. Values are expressed as the mean SEM (ANOVA followed by Tukey’s test). F(6, 35) = 3.19; p = 0.001. * p < 0.05 vs. naive; ## p < 0.001 vs. Ctr; # p < 0.05 vs. Ctr. Ctr: control Cit: citalopram; etx: etifoxine; D: vitamin D; AA: ascorbic acid; SEM, standard error of the mean.

