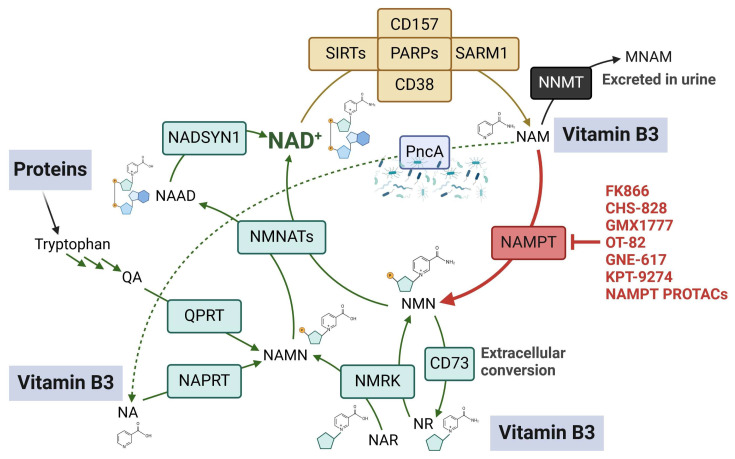
Figure 1.
Overview of NAD+-biosynthetic routes. Green arrows represent the pathways that could be enabled in response to the inhibition of the predominant salvage pathway (red arrow) by NAMPT inhibitors. The yellow arrow represents NAD+ consumption through diverse NAD+-degrading enzymes. This figure was created with BioRender.com (accessed on 28 January 2024).

