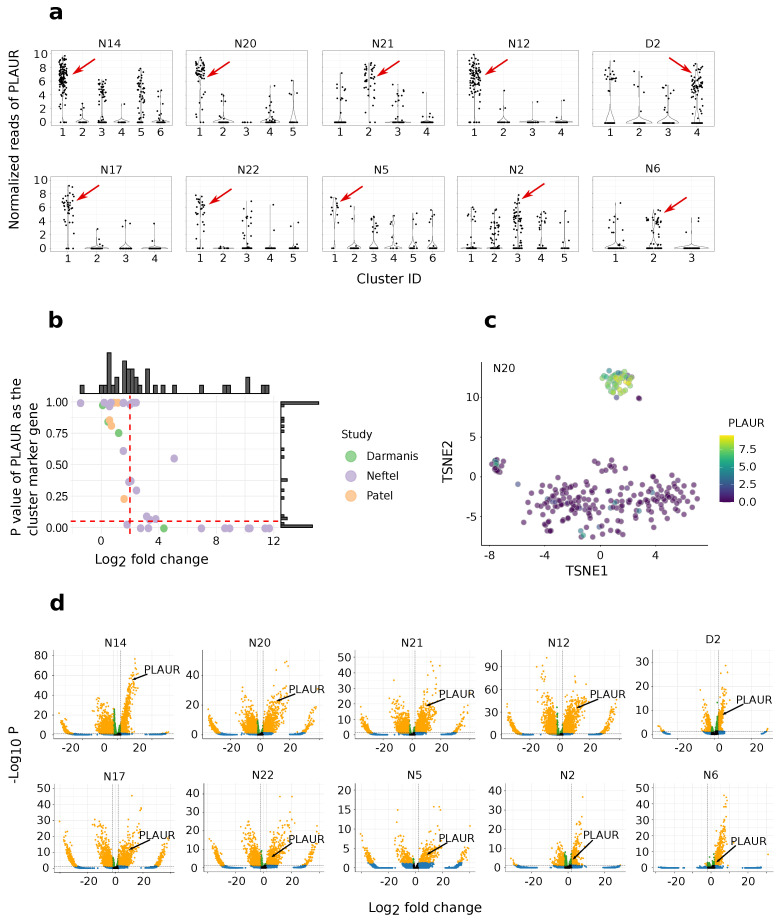
Figure 3.
Discovering PLAUR-represented clusters. (a) Examples of PLAUR expression in respect to clusters. Each black dot represents a cell. The red arrows point to the clusters with the highest percentage of PLAUR-expressing cells. Note that the normalized reads are only comparable within the same sample. (b) A PLAUR-featuring cluster illustrated in TSNE from sample N20. (c) Log-fold changes versus the adjusted p-value of PLAUR as a cluster marker for the clusters that have the highest percentage of PLAUR-expressing cells in each sample. The horizontal red dash line is the adjusted p-value criteria p < 0.05 and the vertical red dashed line is logFC > 2. Selected clusters exhibiting PLAUR as their marker gene are in the right bottom corner. (d) Volcano plots for the clusters in which PLAUR passes the marker gene criteria. The criteria for the marker genes are logFC > 2 and p-value < 0.05. Markers that pass these criteria are colored in yellow. Over-expressed marker genes are on the right side of the coordinate.

