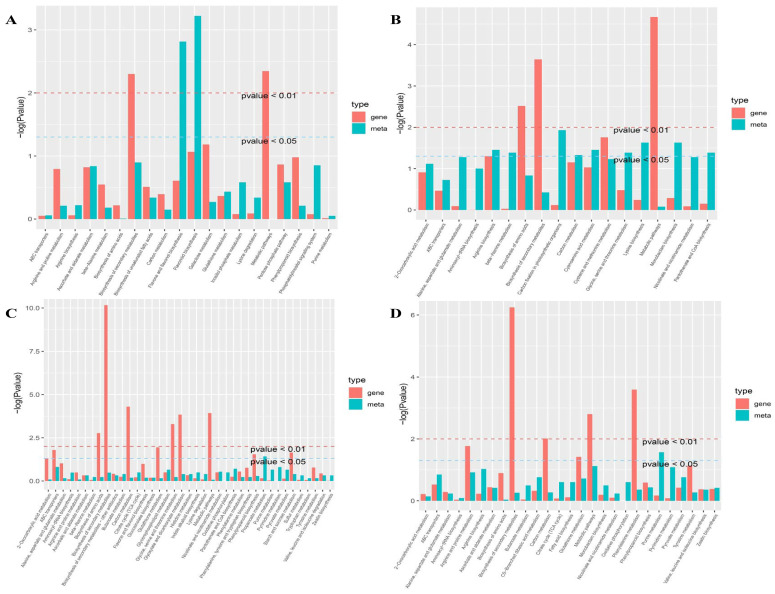
Figure 5.
p value histograms for the KEGG enrichment analysis under drought conditions and during rehydration. (A) p value histogram for the KEGG enrichment analysis of DS under drought conditions. (B) p value histogram for the KEGG enrichment analysis of DT under drought conditions. (C) p value histogram for the KEGG enrichment analysis of DS during rehydration. (D) p value histogram for the KEGG enrichment analysis of DT during rehydration. The abscissa of the histograms presents the metabolic pathways. Red and green represent the enriched p values for the differentially expressed genes and differentially abundant metabolites, respectively.

