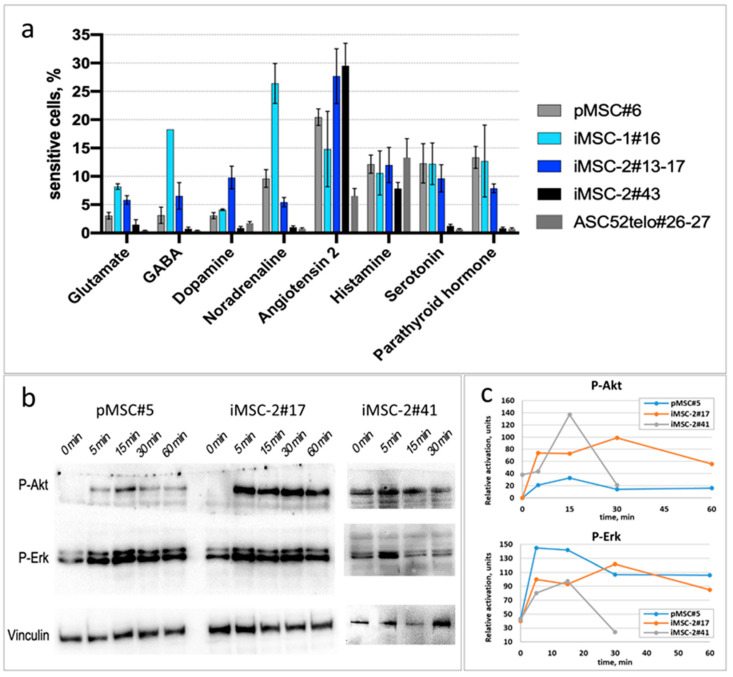
Figure 6.
iMSC response to hormones. (a) The portion of cells, responded to glutamate (10−5 M), GABA (2 × 10⁻⁵ M), dopamine (10−5 M), noradrenaline (10−6 M), angiotensin II (10−8 M), histamine (10−6 M), 5-HT (10−5 M) and PTH (10−8 M) by increase in cytoplasmic Ca2+ influx. (b,c) AKT and ERK phosphorylation in response to insulin. Western blot of MSC samples with P-AKT and P-ERK specific antibodies. (c) Vinculin content was used as a reference for densitometry of P-AKT and P-ERK bands.

