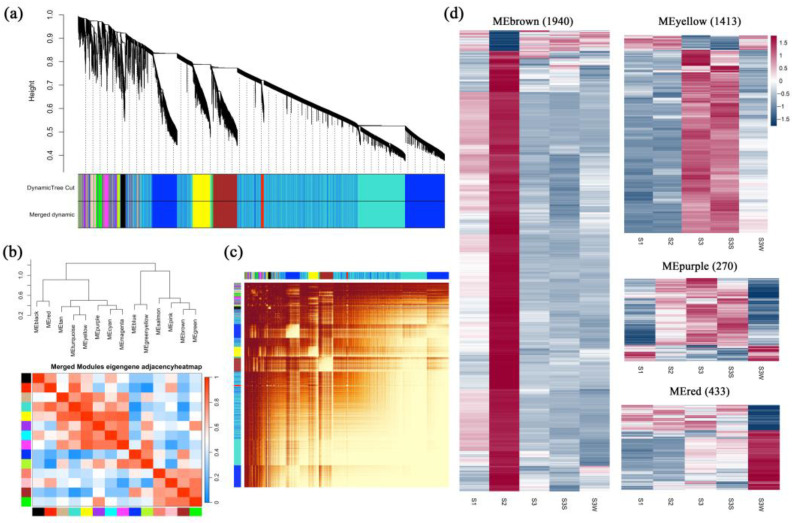
Figure 3.
Weighted gene coexpression network analysis (WGCNA). (a) Cluster dendrogram. Fourteen distinct modules and a grey module were obtained. (b) Eigengene adjacency heatmap of the modules. The cluster tree indicates the correlations between the modules. A heatmap representing the Pearson correlation coefficient is shown. (c) Graphical representation of the topological overlap matrix (TOM). This matrix was used to construct the coexpression network. (d) Gene expression profiles of four modules that were further analysed are represented using heatmaps. FPKMs were scaled and clustered by row.

