Figure 1.
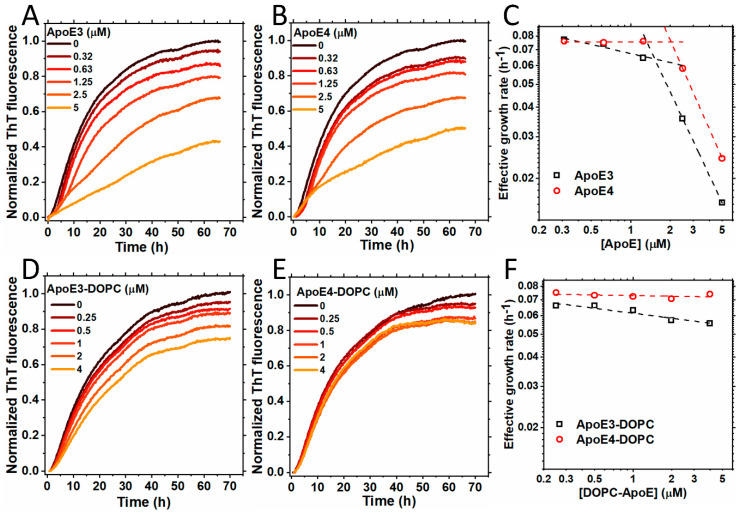
Aggregation of S100A9 in the presence of ApoE isoforms in lipid-free and lipidated forms. (A,B) Aggregation kinetics of 50 µM S100A9 in the presence of increasing concentrations of (A) ApoE3 and (B) ApoE4. The concentrations of ApoE isoforms used here are 0; 0.32; 0.63; 1.25; 2.5; and 5 μM. (C) The effective growth rate of ApoE3 (black dashed line and squares) and ApoE4 (red dashed line and circles) were obtained from the half-time values in (A,B), respectively. The dashed lines are to guide the eye. (D,E) Aggregation kinetics of 50 µM S100A9 in the presence of an increasing concentration of lipidated forms of ApoE isoforms, i.e., (D) ApoE3-DOPC and (E) ApoE4-DOPC, respectively. The concentrations of ApoE isoforms used here are 0; 0.25; 0.5; 1; 2; and 4 μM. (F) The effective growth rate of ApoE3-DOPC (black dashed line and squares) and ApoE4-DOPC (red dashed line and circles) are obtained from the half-time values in (D,E), respectively. The dashed lines are to guide the eye. The reaction is performed in PBS buffer containing 1 mM sodium azide at 42 °C in non-stirring conditions. A total of 20 μM ThT is used to monitor the aggregation kinetics.

