Figure 6.
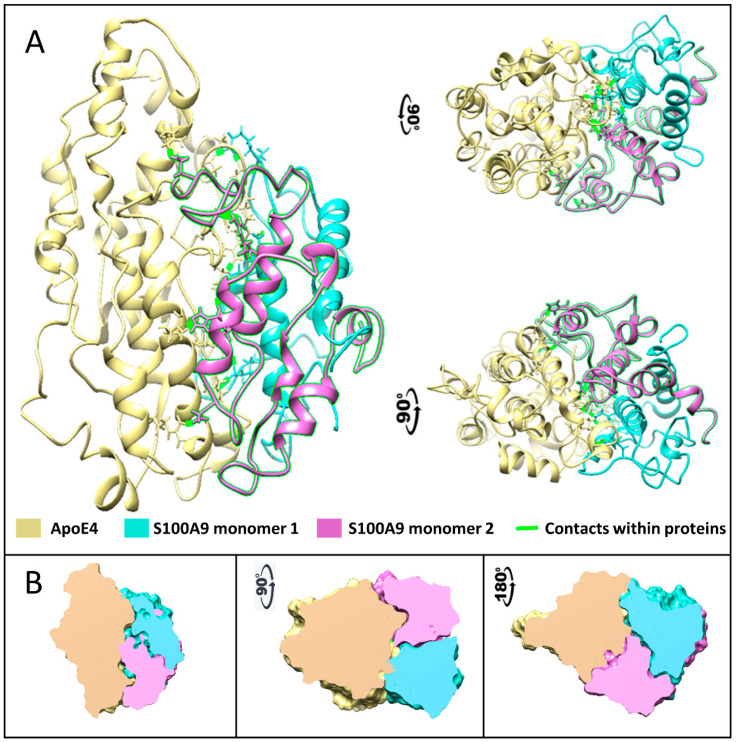
Complex formed between native S100A9 and ApoE4 calculated using multiscale MD simulation. (A) The protein structures are shown by ribbon backbone models in three orientations to highlight the mirror symmetry of S100A9 dimer in the complex with ApoE4. ApoE is shown in yellow, one S100A9 monomer is shown in sea blue, and another in pink. Amino acids that form contacts are shown as sticks with contacts highlighted in fluorescent green. (B) The cross-sections through the Connolly surfaces are used in the same three orientations to show the size and shape of protein–protein contact surfaces, illustrating large interaction surfaces and the related symmetry within the complex. ApoE is shown in yellow, one S100A9 monomer is shown in sea blue, and another in pink. The color coding of interacting proteins as in (A).

