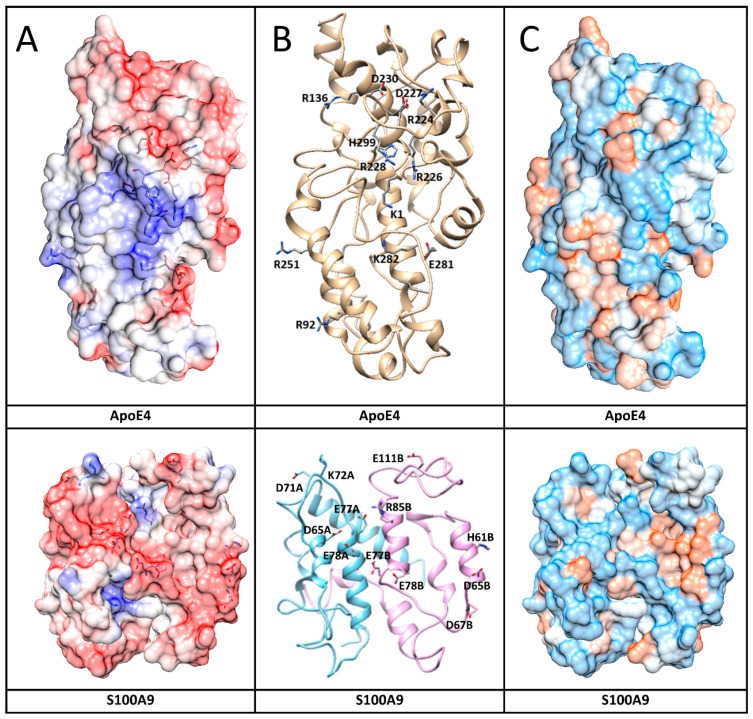
Figure 7.
Interaction surfaces of human ApoE4 and S100A9 shown together with amino acid residues involved in the interactions. (A) Protein electric fields are mapped on the Connolly surface on a scale of −6 to 6 kBT/e, where red color coding corresponds to negatively charged residues, blue – to positive charged residues and white – to neutral residues. Interacting residues in both protein surfaces are shown by sticks. The fields clearly show a blue-positive ridge on ApoE4 that can match a red-negative ridge on S100A9. The surfaces are partially transparent to make the contact amino acids visible as sticks. (B) Protein backbone shows protein conformations that support formation of the complex. Sticks and related names mark the amino acids that form contacts. (C) Connolly surface polarity models of ApoE4 and S100A9 with polar residues shown in blue, hydrophobic – in brown, and intermediate – in white on the protein surfaces.

