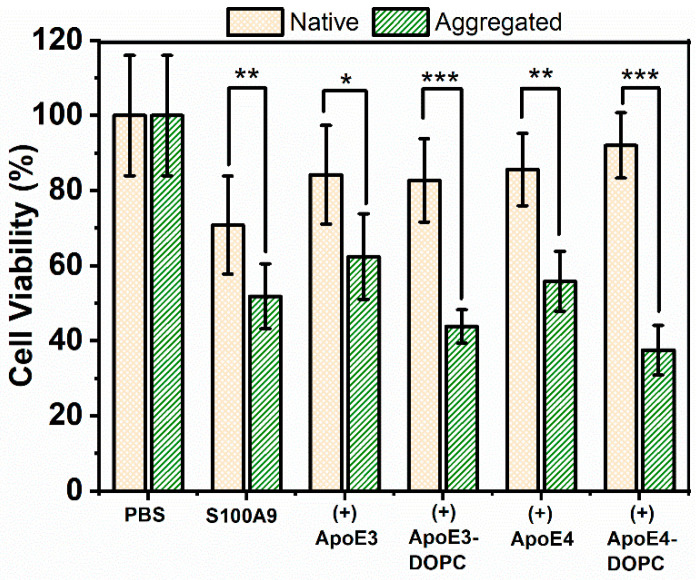
Figure 8.
Cytotoxicity of S100A9-ApoE amyloids on SH-SY5Y neuroblastoma cells measured by the MTT assay. Viability of SH-SY5Y neuroblastoma cells was measured after 24 h co-incubation with S100A9 amyloids by monitoring the absorbance of MTT at 570 nm. Yellow bars with crossed pattern correspond to cells treated with S100A9 or S100A9 mixed with ApoE isoforms in the native state, and green bars with dash pattern correspond to cells treated with S100A9 or S100A9 mixed with ApoE in the aggregated state. The native state corresponds to freshly purified 100 μM S100A9 in the presence or absence of 5 μM ApoE mixed just prior to addition to the cells. The aggregated state corresponds to 100 μM S100A9 aggregated for 72 h at 42 °C in the presence or absence of 5 μM ApoE. Different forms of ApoE used in the experiment are shown along the x-axis. The final concentration of S100A9 incubated with cells was 10 μM. T-test was used to calculate p-values: * corresponds to p < 0.05, **—p < 0.01 and ***—p < 0.005.

