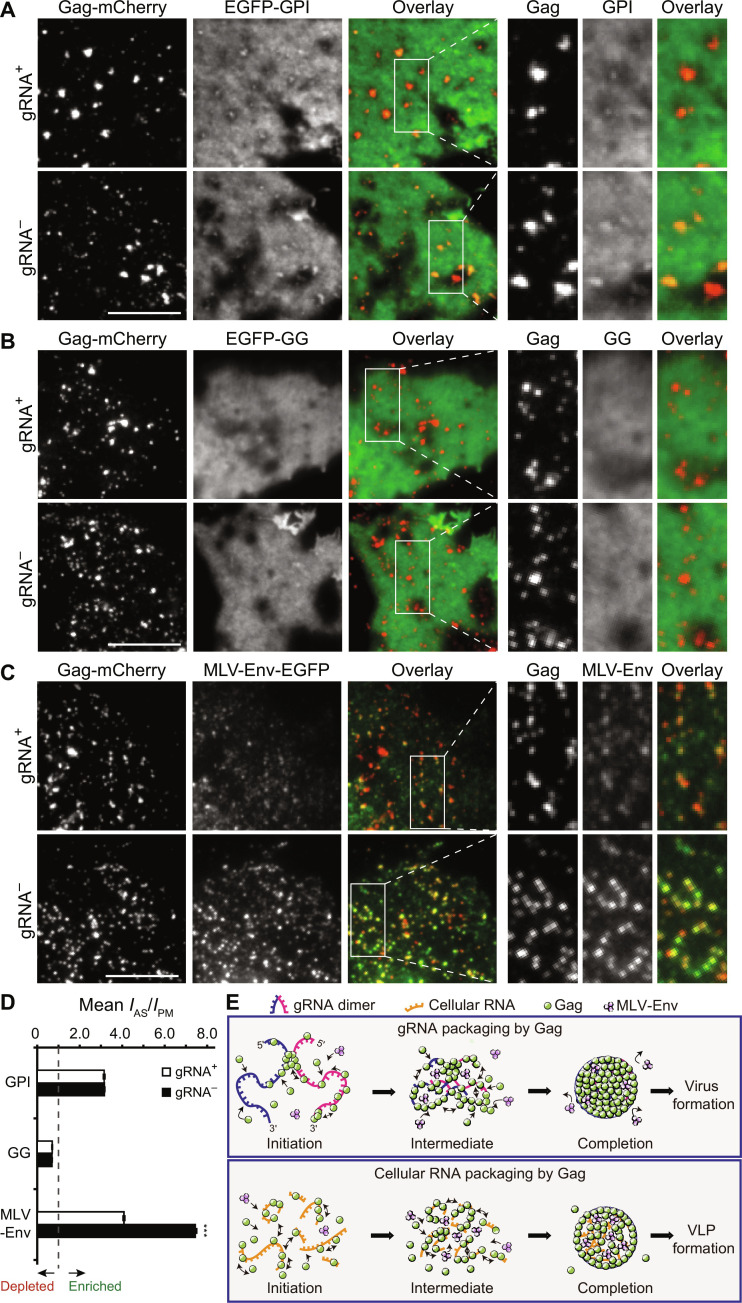
Fig. 4. PM proteins exhibit differential partitioning into cellular RNA–mediated versus gRNA-mediated particle assembly sites in COS7 cells.
(A to C) Representative TIRF images of Gag-mCherry and (A) EGFP-GPI, (B) EGFP-GG, and (C) MLV-Env-EGFP at the PM of gRNA+ and gRNA− cells at ~18 hours after transfection. The panels on the right are magnified images of the boxed areas in the images. Scale bars, 10 μm. (D) Extents of enrichment and depletion of indicated PM proteins at the Gag assembly sites (means ± SEM, IAS/IPM) in gRNA+ and gRNA− cells (see Materials and Methods). For EGFP-GPI, n = 3769 assembly sites from 29 gRNA+ cells and n = 6919 assembly sites from 25 gRNA− cells. For EGFP-GG, n = 4203 assembly sites from 27 gRNA+ cells and n = 6103 assembly sites from 23 gRNA− cells. For MLV-Env-EGFP, n = 6328 assembly sites from 43 gRNA+ cells and n = 7445 assembly sites from 39 gRNA− cells. ***P < 0.001). (E) Schematic model illustrating gRNA- and cellular RNA–mediated Gag multimerization and MLV-Env partitioning at assembly sites. The compact and crowded assembly environment created by gRNA accommodates limited MLV-Env molecules, whereas the less compact and more fluid environment created by cellular RNA is more permissive for MLV-Env incorporation.

