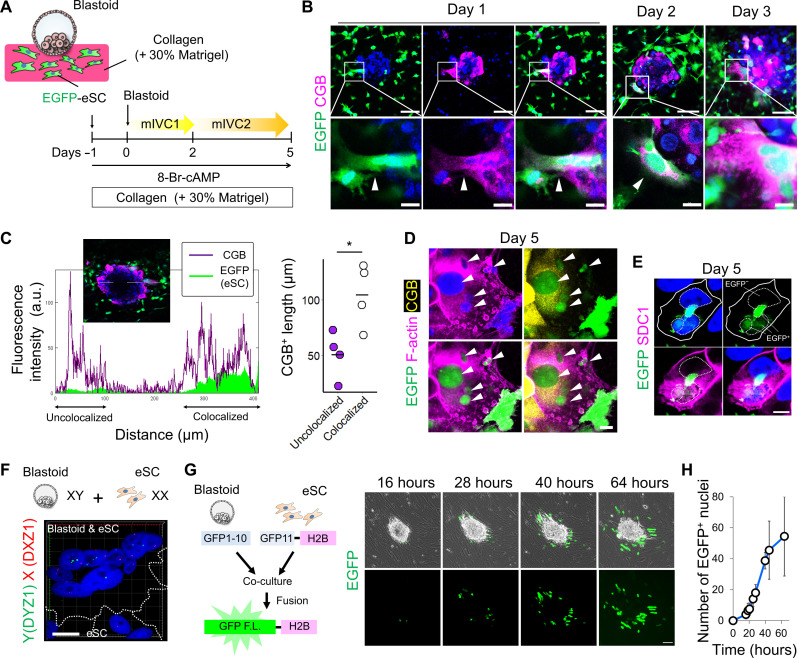
Fig. 5. Interaction of the invading syncytium with eSC.
(A) Schematic representation of the culture procedure. (B) Whole-mount imaging of blastoids cocultured with eSC (EGFP+) in a collagen-based gel on days 1, 2, and 3 stained for CGB; nuclei stained with Hoechst (blue). Scale bars, 100 μm and 20 μm (magnified). (C) Colocalization analysis of CGB+ cells and EGFP+ eSC (left). The y axis indicates fluorescence intensity, and the x axis shows distance. Quantification of CGB+ cell length colocalized with eSC or not (right); n = 4 independent experiments. *P < 0.05. a.u., arbitrary units. (D and E) Whole-mount imaging of blastoids cocultured with eSC (EGFP+) on day 5; nuclei stained with Hoechst (blue). Scale bar, 20 μm. (D) Stained for CGB and F-actin. Arrowheads indicate multiple EGFP+ nuclei in the same cell. (E) Stained for SDC1. Solid lines indicate cell boundaries; dashed lines mark nuclei. (F) X (DXZ1) and Y (DYZ1) chromosome detection of multinucleated cells in blastoid (SEES3-derived) cocultured with eSC. Maximum projection of fluorescence image; nuclei stained with Hoechst (blue). Scale bar, 20 μm. The dashed lines delineate the outlines of the cells. (G) Schematic of experimental design (left). Phase contrast and fluorescence images of attached blastoid expressing GFP1-10 cocultured with eSC expressing GFP11-tagged histone H2B at 16, 28, 40, and 64 hours after coculture (right). Scale bar, 100 μm. (H) Quantification of EGFP+ nuclei during coculture; n = 4 independent coculture experiments.

