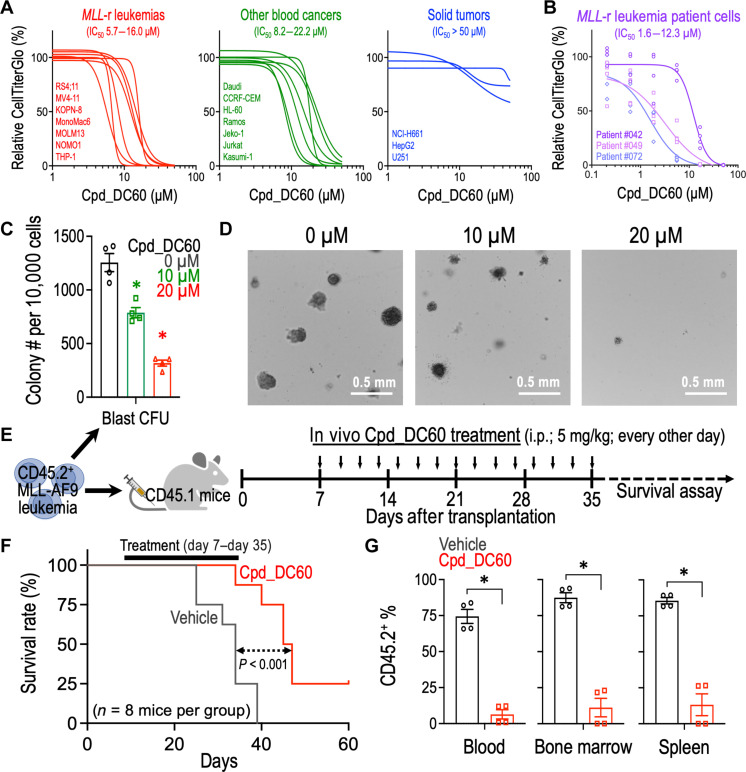
Fig. 6. Treatment of Cpd_DC60 suppresses leukemia progression in vivo.
(A) Effect of Cpd_DC60 on the relative CellTiter Glo signal (% to DMSO control) in MLL-r leukemia cells (red), non–MLL-r blood cancer cells (green), solid tumor cells (blue), and (B) MLL-r leukemia patient cells. Cells were incubated with Cpd_DC60 for 96 hours. The curve-fit model was performed by GraphPad Prism v9.1.1. (C) Effect of Cpd_DC60 on the blast-like colony-forming ability of MLL-AF9 leukemic cells (n = 4). (D) Representative images of the third replating colonies from MLL-AF9 leukemic cells treated with 0, 10, and 20 μM Cpd_DC60. (E) Schematic outline of the in vivo MLL-AF9 leukemia model for Cpd_DC60 treatment. (F) Kaplan-Meier survival curve of recipient mice receiving MLL-AF9 leukemia with or without Cpd_DC60 regimen (n = 8 mice per group). (G) Percentage of CD45.2+ (donor) cells in the peripheral blood, BM, and spleen of the CD45.1+ recipient mice with or without Cpd_DC60 treatment (n = 4 mice per group; day 36 after transplantation). The CD45.2+ cells represented the engraftment of leukemic MLL-AF9 cells in recipient mice. Data are represented as means ± SEM. *P < 0.01 by two-sided Student’s t test. i.p., intraperitoneal.

