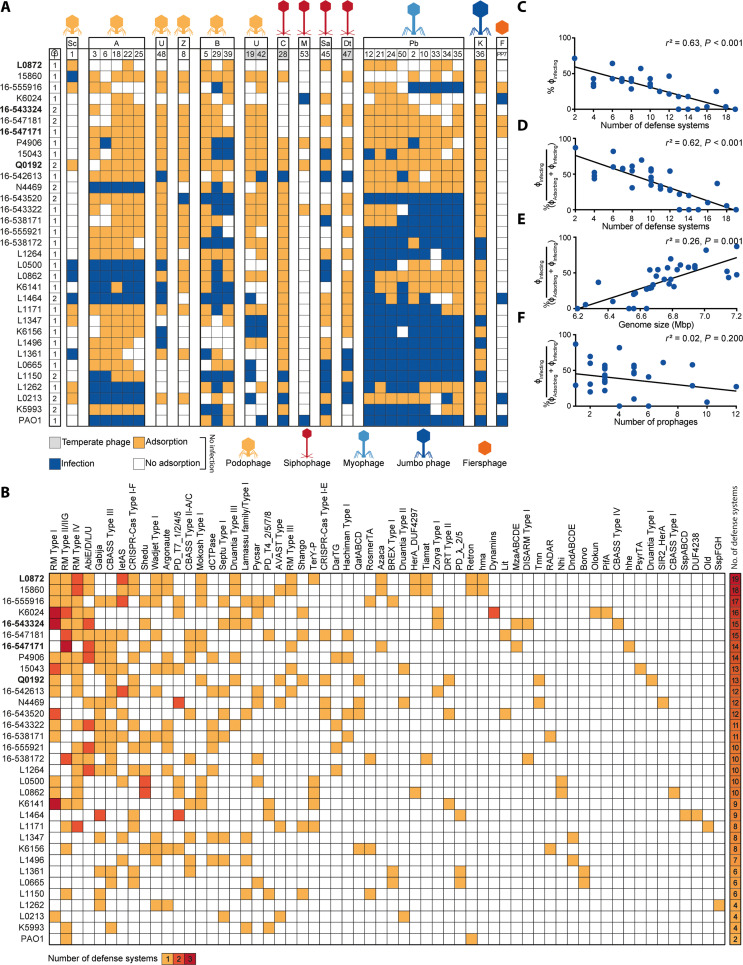
Fig. 2. Innate and adaptive defense systems correlate with phage resistance.
(A) Host range of phages against 32 P. aeruginosa clinical isolates and strain PAO1. Phages are clustered by phylogeny (table S3). Phage-bacteria interactions are depicted as infection (blue), adsorption (>50%) but no infection (orange), or no interaction (white). Letters above the phage numbers indicate family or genus (for phages unassigned to a family): A, Autographiviridae; B, Bruynoghevirus; C, Casadabanvirus; Dt, Detrevirus; F, Fiersviridae; K, Phikzvirus; M, Mesyanzhinovviridae; Pb, Pbunavirus; Sa, Samunavirus; Sc, Schitoviridae; Z, Zobellviridae; U, unassigned. Strains not infected by phages in our panel are highlighted in bold. (B) DS found in the P. aeruginosa clinical isolates. The number of instances of each defense system type per strain is indicated in yellow, orange, or red for 1, 2, or 3, respectively. The total number of DS found per strain is indicated in a heatmap bar on the right. A complete list of the DS found in the clinical isolates can be found in table S2. (C) Linear regression analysis of how a number of DS found in the P. aeruginosa clinical isolates and PAO1 correlate with the levels of phage resistance, i.e., phages that could not adsorb and that adsorbed but failed to establish a productive infection. (D) Linear regression analysis of how a number of DS correlate with the levels of phage resistance calculated as the percentage of adsorbing phages that can establish a productive infection [% ϕInfecting/(ϕAdsorbing + ϕInfecting)]. (E) Linear regression analysis of how genome size correlates with phages that can establish a productive infection. (F) Linear regression analysis of how the number of prophages correlates with phages that can establish a productive infection. In (C) to (F), r2 represents R-squared, a goodness-of-fit measure for the linear regression models.

