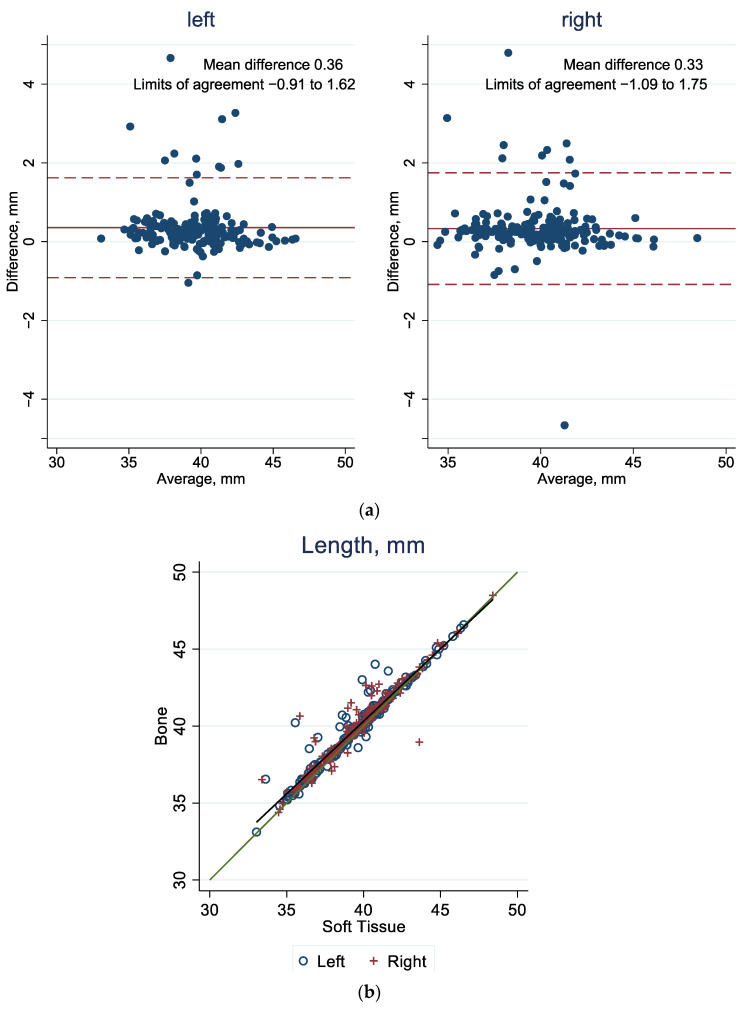
Figure 4.
(a) Agreement of orbital length in bone and soft tissue windows: Bland–Altman plot, with the mean difference (solid red line) and the 95% limit of agreement (between the dashed red lines). (b) Agreement of orbital length in bone and soft tissue windows. The green line represents the diagonal, and the gray line represents the best fit. See Appendix A Table A1 for corresponding numbers.

