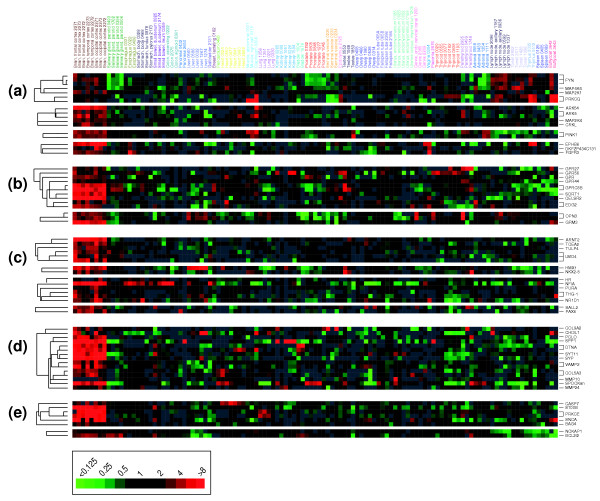
Figure 3.

Brain-selective expression of functionally annotated gene sets. Hierarchical cluster of 115 normal tissue specimens and annotated gene sets representing the following examples of (a-c) specific molecular functions (a) tyrosine kinase, (b) G-protein-coupled receptor, (c) transcription factor, (d) cellular components (extracellular matrix) or (e) biological processes (programmed cell death). Samples are ordered as in Figure 2. Genes are ordered by hierarchical clustering. For gene selection, we considered genes that were well measured in at least 50% of samples; no ratio-fold cutoff was applied. Only features representing brain-specific expression are shown here; the complete clusters are available as Additional data files 4 and 7.
